Measuring Trade Efficiency
Can your current trading strategy be enhanced without making radical changes?
To understand where your strategy may be lacking, or where it could be improved, we need to break down the trades to view any developing inefficiencies. The following tools can be used for any style of trading or any instrument.
Maximum Adverse Excursion
Maximum Adverse Excursion (MAE) is a measure of how far a position will move against you at any given time before it is closed. MAE essentially tells us how much pain we may need to see before the position becomes profitable.
An entry with a good edge will have a smaller MAE than one with a poor entry edge.
With shorter-term systems that rely on a high entry edge, the MAE should be very low. Trend systems that require time for trends to develop will tend toward a higher MAE reading.
Measuring and plotting MAE readings can highlight an appropriate initial stop loss point.
For example, you observe that many profitable trades initially move 2% against the entry point then recover soon after to finish in profit. Yet positions that move more than 5% against the entry rarely recover and almost always close at a loss.
Therefore you might research a stop loss level circa -5%, or at least beyond the -2% threshold.
Whilst MAE measures the entry edge for initial stop loss placement, the other important element is managing and exiting positions. For this we can use Maximum Favorable Excursion (MFE) which measures how much of the possible profit is locked in.
This is an important concept with trend and momentum systems where some degree of open profit must be given back.
MAE Example
Let’s assume you buy at $10.00 and watch the position rise to $20.00 at which time it reverses. You exit the position at $18.00. The potential profit was $10.00 in total but you locked in $8.00, so the MFE was 80%.
Unlike MAE where we want the lowest reading, when it comes to MFE we want the highest reading.
If the exit efficiency of your strategy is low or average, i.e. less than 60%, then some research should be done on trade management or the exit.
Total Efficiency
Lastly we can look at the strategy fully using total efficiency. The total efficiency shows how much of the total move has been realized as profit. Total efficiency may range from –100% to +100%. Positive efficiency means the trade was profitable; Negative efficiency means the trade was unprofitable.
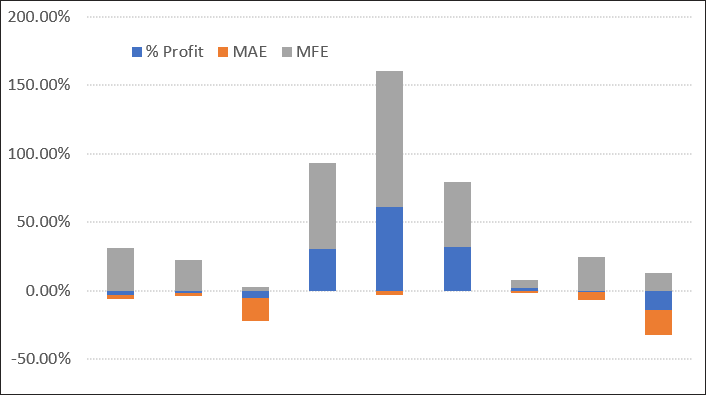
The following chart plots a handful of trades from a typical trend following strategy.
The blue portion shows the realised profit or loss. The grey shade shows the MFE, or how far the position went in our favour at its best point. The orange shows the MAE, or how far the position went against us before it closed out.
The data shown is not enough to make an informed decision on the strategy entry/exit efficiency. To do that we’d need a lot more. However, it does appear to show reasonable profit give back. If that was a trait across a broader selection of trades then some further research on the trailing stop may provide a better outcome.
![]()