Single Market Systems – Be Wary; A Red Flag Warning
When I hear of a single market system I shudder. Have you come across a strategy that trades just one market?
That’s a big red flag, in my opinion.
Why?
1. Data mining
2. It’s unlikely to be robust.
Data mining is the process of extracting hidden patterns from extremely large sets of data. The overall goal is to extract information from a data set and transform it into an understandable structure for further use. Data mining is commonly used in a range of applications such as marketing, fraud detection, traffic flow and scientific discovery. And trading. Data mining encompasses a population of trades listed in the 1000’s – the more the better.
Data mining is a valid method to discover the best rule(s) but budding systems traders should ensure that the results are statistically significant to avoid the risk of discovering ‘lucky’ or random rules.
Robustness is the key
Robustness refers to the ability of the strategy to perform into the future. Many strategies being sold are designed with hindsight. Yet we also know the future will never be exactly the same as the past, so the more robust the strategy, the more likely it will continue to work into the future.
A random pattern traded on a single market? Not robust and likely to fail. Single market systems are an immediate red flag to me.
Single instrument systems tend to be used by spruikers. Why?
1. they can find random patterns that ‘appear’ to hold the magic key to trading success
2. they display near-perfect equity growth
3. they have very high win rates
The perfect ‘get rich quick’ solution?
Always good for selling a system but not much good for trading into the future.
Possibly the best way to explain this is to show an example.
The equity curve below, highlighted in orange, was a Gold Miner’s (GDX) strategy that appeared in Stocks & Commodities magazine toward the end of 2012.
It showed a CAGR of 40% with a maximum drawdown of 15% and no losing years.
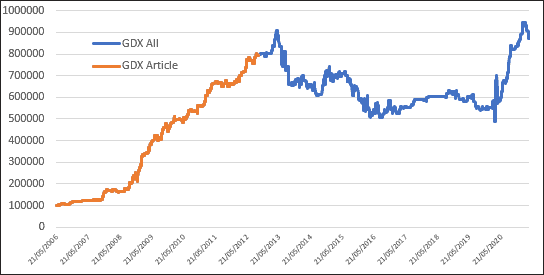
Now let’s walk forward. The blue line is how that strategy has performed since the article was published. It continued to work well for a small period, then went into a steep drawdown.
As of today, the strategy has a CAGR of 15% and a maximum drawdown of 46%.
Not overly compelling.
Next, we’ll discuss how to determine if a strategy is more likely to be robust and survive into the future.
![]()