

Adding Value To Your Investment Portfolio During A ‘Lost Decade’
After 16 years of strong performance led by U.S. mega-cap stocks the secular bull market is potentially entering its later stages (average length 18 years). It’s prudent to reflect on what lies ahead, not just for the next couple of years, but over the next 5 to 10 years. A secular bear phase is characterized by subpar returns or potentially negative real returns adjusted for inflation over many years.
Following the 1929 Crash, U.S. stocks hit their lowest point in July 1932, with a full recovery not achieved until November 23, 1954, taking 25 years to regain its nominal high. However, this overstates the recovery time for most investors, as broader market measures and reinvested dividends shortened the effective recovery to about 15 years, depending on the metrics used.
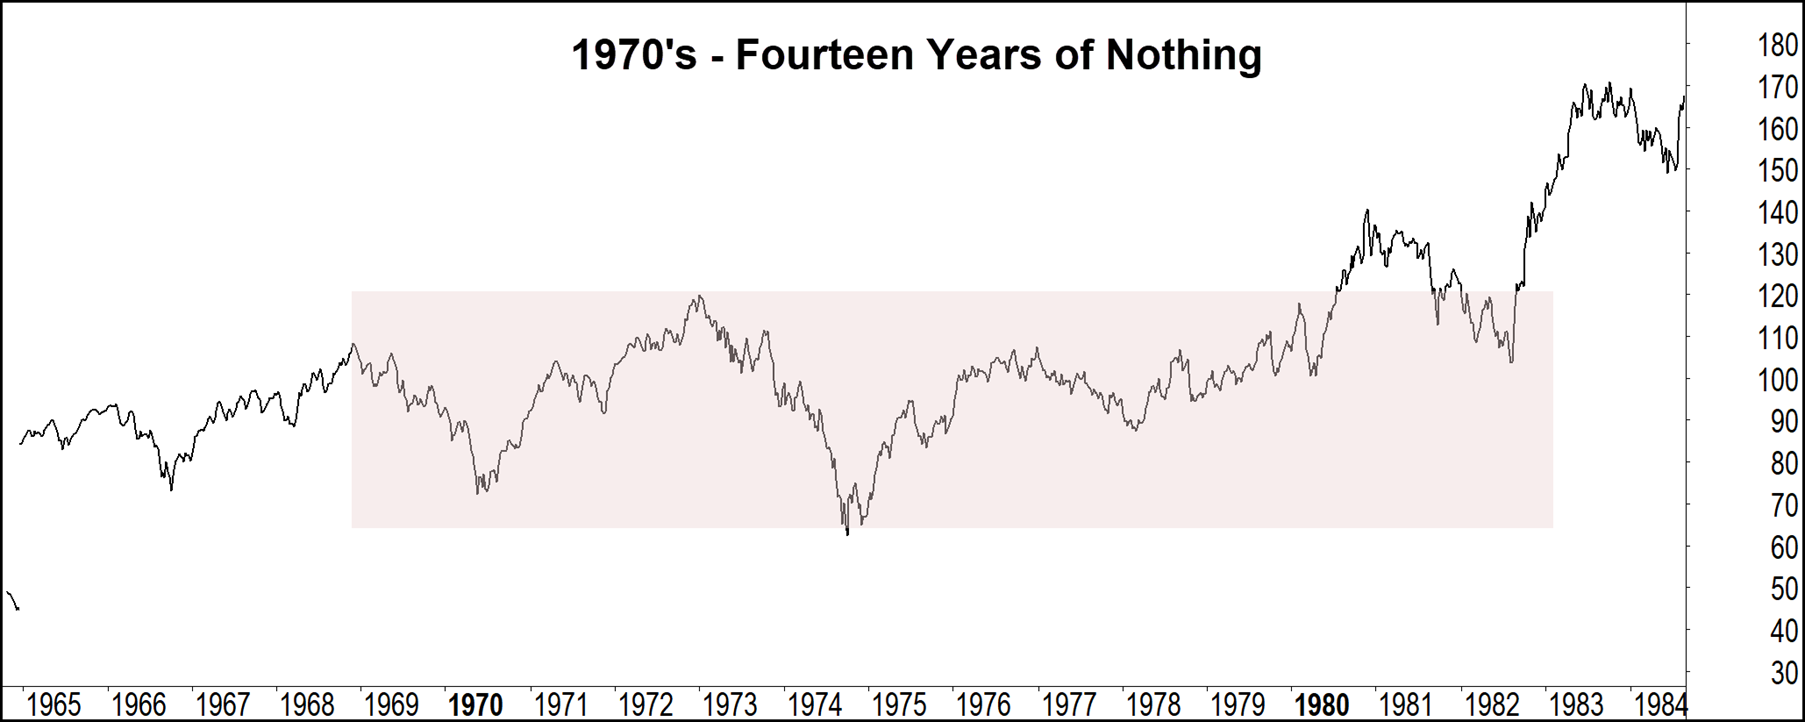
The following chart shows next significant downturn which occurred between 1968 and 1982, with stocks returning zero in real terms for fourteen years if dividends were reinvested for the period.
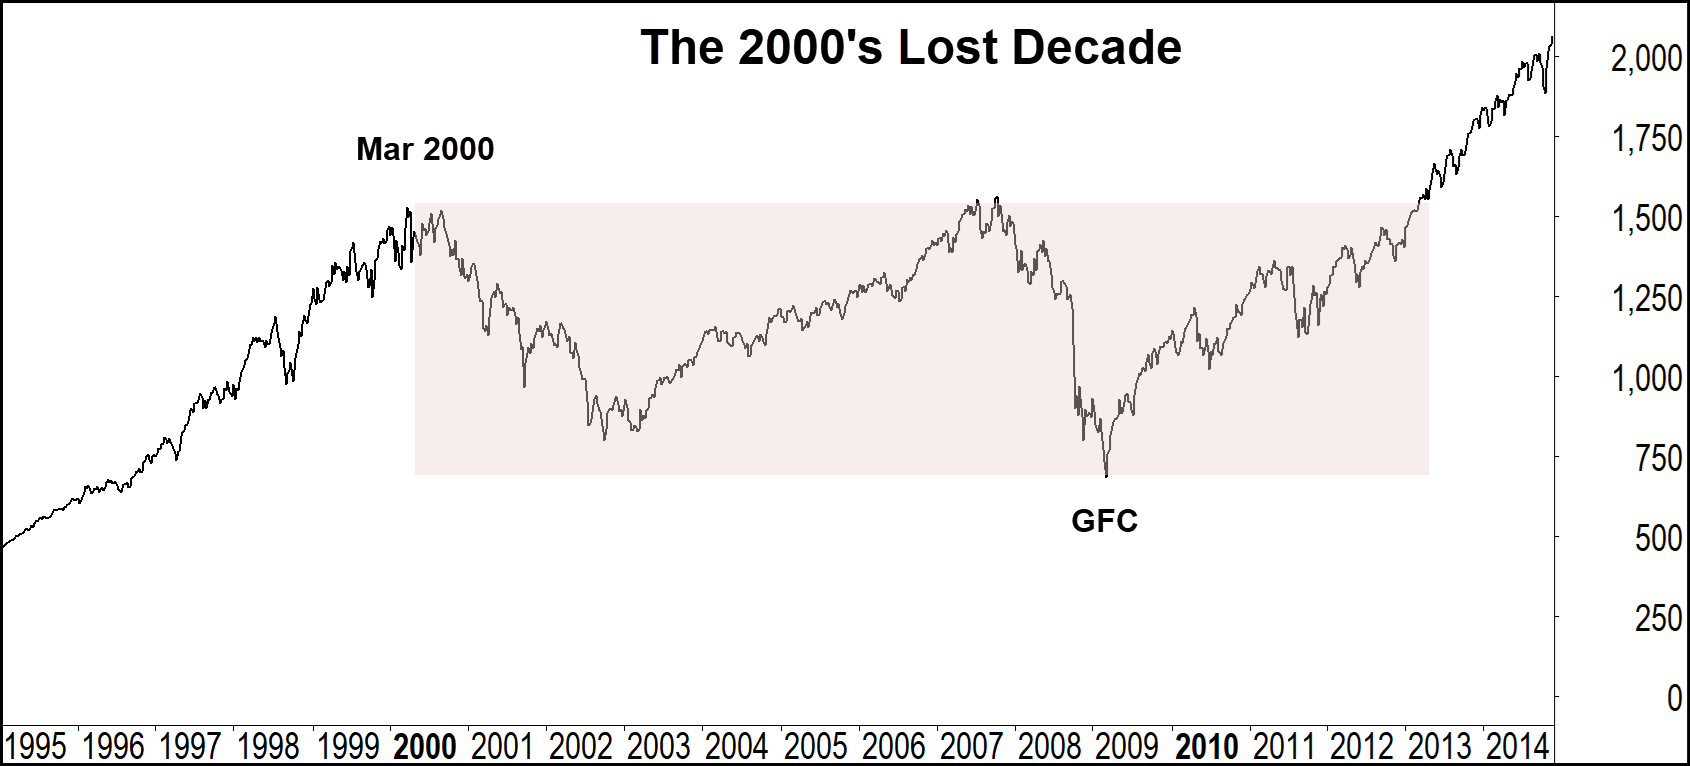
In more recent times, after the dot-com bubble burst in March 2000, U.S. stock prices plummeted, and the entire cycle of decline and recovery extended over seven years until July 2007. The Global Financial Crisis followed, with the market reaching its lowest level in February 2009 and requiring four years to regain its prior value.
All in all, this period was deemed The Lost Decade.
In the world of investing, balancing reasonable returns with risk management is an ongoing challenge, more so during a secular bear market. As markets fluctuate and trends shift, investors are constantly searching for new ways to enhance portfolio outcomes.
One possibility to increase returns during sustained bear markets is an allocation to tactical directional strategies.
These strategies, such as the Harbourside Multi Strategy, offer a range of advantages, complementing conventional equity investments and adapting to evolving market environments. Benefits include enhanced risk-adjusted returns, lower correlations to standard buy-and-hold portfolios or passive managed funds and a differentiation story to open discussions with clients.
A frequent critique of tactical asset management, often countered by advocates of a buy-and-hold strategy, is the belief that markets will always recover over time. While this may hold true, as shown, above secular bear markets tend to suffer steep declines and/or prolonged underperformance.
THE HARBOURSIDE MULTI STRATEGY
The Harbourside Multi Strategy is a tactical directional portfolio that uses a top-down quantitative approach to selectively invest in high growth stocks on the Australian and US markets. While being a long-only approach, the strategy has the mandate to revert to a 100% cash position during sustained downward environments. This mechanism controls downside exposure that in turn attempts to increase the long-term risk adjusted return profile.
The Multi Strategy Program relies on dual momentum on two-time frames and in two separate equity markets. It looks to identify the strongest stocks in each market on a relative strength basis while also making sure that there is positive market momentum. The use of this dual momentum approach across markets and timeframes generates a very robust overall approach. It is an actively managed strategy, highly sensitive to overall market conditions often moving quickly between a 100% cash and 100% invested position. A risk-averse approach is still maintained by turning to cash in weaker markets.
In summary, the Harbourside Multi Strategy is a tool that typically isn’t in an advisors toolbox.
PRACTICAL APPLICATION EXAMPLE
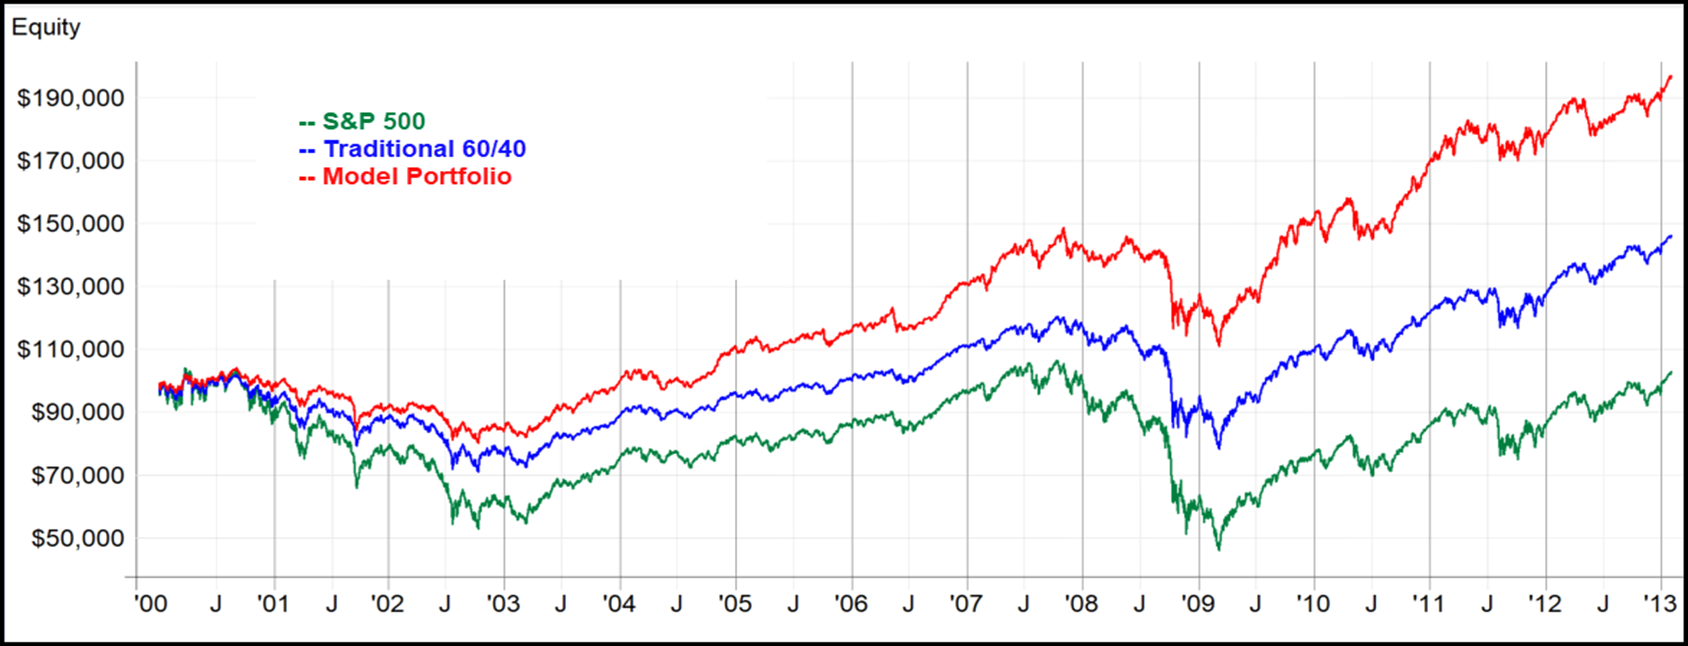
For this analysis, we will examine the ‘Lost Decade’ period from January 2000 to February 2013, segmented into three time frames:
- January 2000 – July 2007: The dot-com bubble burst and subsequent recovery
- July 2007 – February 2013: The Global Financial Crisis and its recovery
- January 2000 – February 2013: The complete ‘Lost Decade’ period
Two portfolio varieties will be used:
- The Traditional Portfolio used is a simplified 60/40 allocation, comprising 60% SPDR S&P 500 ETF (SPY) and 40% iShares Core US Aggregate Bond ETF (AGG).
- The Model Portfolio consists of 40% SPDR S&P 500 ETF (SPY), 40% iShares Core US Aggregate Bond ETF (AGG), and 20% Harbourside Multi-Strategy^.
We will also compare these two against the S&P 500 index
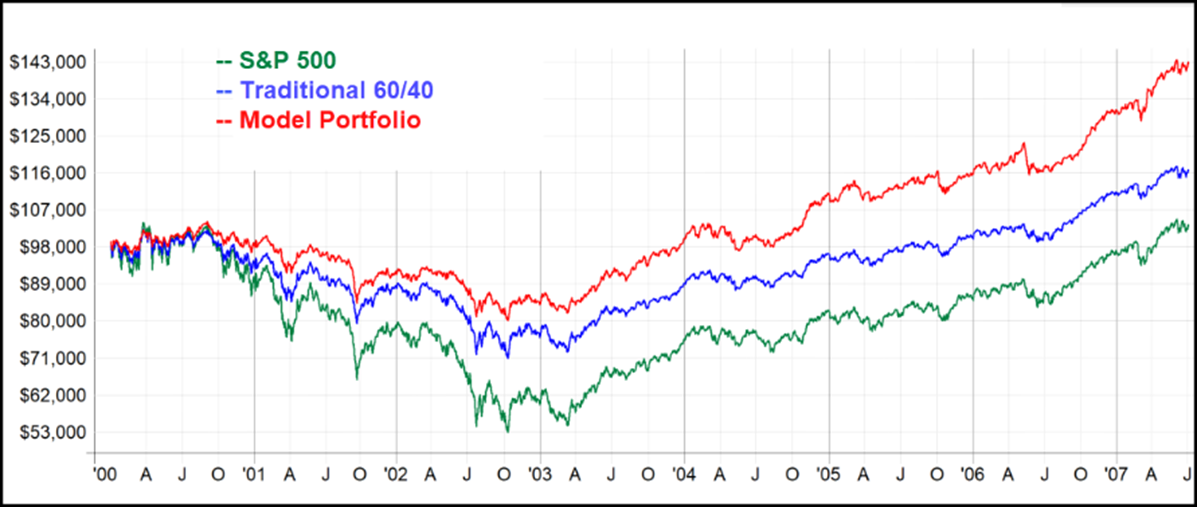
January 2000 – July 2007
From 2000 to 2007, the U.S. stock market faced a sharp decline due to the dot-com bubble burst, with the NASDAQ and S&P 500 dropping significantly by 2002, driven by overvalued tech stocks, corporate scandals, and the 9/11 attacks. A recovery began in 2003, fuelled by low interest rates and strong sector performance, with the S&P 500 rebounding about strongly by mid-2007.
| Capsule Summary | ||||
| CAGR | maxDD | Volatility | Sortino | |
| Model Portfolio | 6.19% | -20.56% | 8.49% | 1.29 |
| Traditional 60/40 | 2.09% | -30.74% | 10.70% | 0.41 |
| S&P 500 | 0.45% | -49.10% | 17.55% | 0.19 |
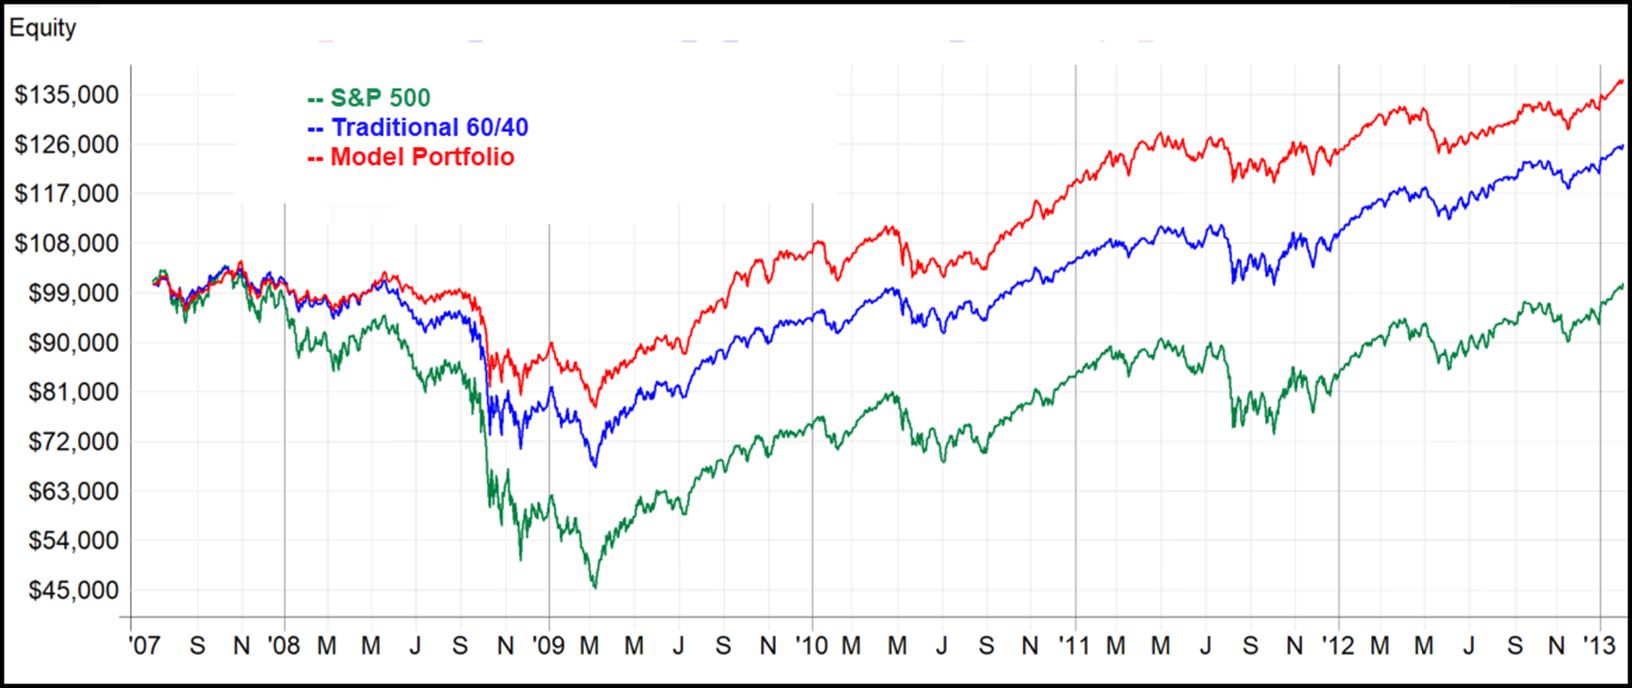
July 2007 – February 2013
From July 2007 to February 2013, the U.S. stock market crashed during the Global Financial Crisis, with the S&P 500 falling 56% by March 2009 due to the housing collapse and banking failures. A recovery began in March 2009, driven by aggressive Federal Reserve actions and government bailouts, with the S&P 500 rising about 95% by February 2013, though still below its 2007 peak. The recovery was uneven, with tech leading gains while economic challenges like high unemployment persisted.
| Capsule Summary | ||||
| CAGR | maxDD | Volatility | Sortino | |
| Model Portfolio | 7.46% | -23.83% | 11.37% | 1.12 |
| Traditional 60/40 | 4.19% | -35.12% | 14.53% | 0.57 |
| S&P 500 | 0.10% | -56.40% | 25.32% | 0.2 |
January 2000 – February 2013
The “Lost Decade” was characterized by volatility and negligible net gains for major indices. The S&P 500’s annualized return was near zero, reflecting the compounding impact of two major crashes. Investors faced challenges from overvalued tech stocks in the early 2000s, followed by financial sector turmoil in the late 2000s. Monetary policy and corporate earnings growth supported recoveries, but structural economic issues limited broader gains.
| Capsule Summary | ||||
| CAGR | maxDD | Volatility | Sortino | |
| Model Portfolio | 6.64% | -23.83% | 9.85% | 1.19 |
| Traditional 60/40 | 2.95% | -35.09% | 12.48% | 0.48 |
| S&P 500 | 0.23% | -56.73% | 21.24% | 0.19 |
SUMMARY
The above examples show how a small allocation to a unique tactical directional strategy can enhance returns, reduce drawdowns and volatility and improve the risk adjusted return of the portfolio.
To summarize, incorporating tactical directional product such as the Harbourside Multi Strategy into an equity portfolio provides multiple advantages, such as improved diversification, greater adaptability in managing investments, enhanced risk-adjusted performance, and a proactive approach to investing. By blending these flexible elements, investors can respond to evolving market dynamics, seize emerging opportunities, and mitigate risks efficiently, thereby maximizing their portfolio’s potential. In today’s intricate investment environment, adopting tactical and directional strategies offers a thoughtful way to pursue stronger portfolio outcomes amid the market’s shifting cyclical and long-term trends.
This Harbourside Multi Strategy is open to Australian investors who meet the requirements of a Wholesale or Sophisticated Investor under the Corporations Act 2001. Minimum investment is $250,000.
For further information contact us at:
Email: [email protected]
Website: shartruwealth.com.au
Phone: 1300 478 424
or sign up to our monthly updates at https://www.thechartist.com.au/managed-accounts/
^Commissions, interest on excess cash, dividends and management fee are included. Performance fees have been excluded. Base currency is USD.
All data sourced from www.norgatedata.com

