Don’t Believe The Rumours – Size Does Matter
When it comes to risk management there are two rules:
The Timid Trader Rule – “If you don’t risk very much, you don’t make very much.”
and
The Bold Trader Rule – “If you risk too much, you go broke“.
There are a few other guidelines which we’ll discuss below, but the question for now is, “How much risk do I use?”
Last weeks article “Risk Management Is A Cop Out” put forward that risk management is all about limiting the loss of your capital. That’s the core goal, but to ensure we don’t become a Timid Trader or a Bold Trader, we need to also ask the question, “How many shares/contracts should I buy/sell in order to get an optimal return for my desired risk tolerance?”
The ‘how many’ question is known as position sizing. But the answer is not so simple, mainly because it depends on the style of trading you’re doing. There many ways to determine how many shares to buy, but we’ll focus on the two basic methods; fixed dollar and fixed fractional.
Fixed Dollar is straight forward and very easy to use. Simply divide your capital into equal parts, such as 10 or 20, and then buy that portion of shares.
If you have a $100,000 account you would divide it into 20 equal parts of 5% and buy $5,000 worth of shares as each signal comes along. Simple, but not necessarily the most efficient way due to volatility. Buying $5,000 of ANZ Bank for $32.00 that on occasion may move 1% in a day, is not the same as buying $5,000 worth of XYZ Ltd for $0.20 that may move 10% on any given day. Volatility is not equalised meaning that one will make or lose a lot more than the other.
When using the Fixed Dollar approach one needs to ‘pigeon hole’ risk by buying companies of the same breed, i.e. buying only blue chips, or buying only small caps, or buying only micro caps. In other words, don’t mix blue chips with micro caps because you’re simply exposing yourself to more risk and more volatility.
Fixed Fractional position sizing on the other hand does equalise risk, albeit it’s somewhat more complicated to grasp. This method is used when the distance between the entry and stop loss varies. For example, you may want to buy ANZ Bank at $33.00 with a stop loss at $32.00 or XYZ Ltd for $0.20 with a stop loss at $0.18. If the stop is triggered on ANZ you are exposed to a 3% decline in equity, but if the stop is hit in XYZ you’re exposed to a 10% decline in equity. Therefore, you want to buy a lot more shares in ANZ to gain the same exposure as you would have in XYZ.
But, as per the Bold Trader Rule, losing 10% of your equity on a single trade will end your trading career very quickly.
We need to accept that a series of losses is possible (extremely probable), so risking 10% of equity on a single trade opens the door to losing a large amount of our capital very quickly. Even if you have a strategy that has a 90% success rate, you will still be exposed to 5 losses in a row, or a 50% decline in capital. So obviously we need to scale that risk back to allow us to travel through a bad series of trades if and when they come.
The following table shows what a probable losing streak will look like dependent on the success rate of your strategy:
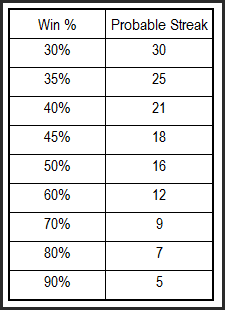
If we offer the market some humility and suggest we’d only be right 50% of the time, which many successful traders are, then we should expect to have 16 losing trades in a row at some stage. It may not happen for a week, a month, a year or a decade, but mathematically it will happen. So, with that in mind we now need to ask ourselves how much of our capital are we willing to lose should the nasty losing streak hit?
So here’s one of those guidelines I was going to mention…
The amount of capital decline you think you can handle is probably twice the amount you really can cope with in real life.
Losing money on paper is one thing. Losing money in reality is a very different ball game.
Let’s assume you can handle an equity decline of 20%, and let’s assume your strategy has a success rate of 60%. Therefore, you can expect to have a losing streak of 12 trades at some stage. As such you cannot risk anymore than 1.6% of your account equity on any given trade (20/12 = 1.666). Many textbooks will have you believe you can risk 2% on each trade, but at 2% you will have a drawdown of 24% – which is above your threshold.
Remember, when it comes to trading, the long term winners are the best losers. In other words, winners don’t blow their account up, or they don’t get psyched out of trading due to a drawdown beyond their coping ability.
So assume we can risk 1.6% of our account on our hypothetical ANZ and XYZ trades. What we need to do to equalise risk at 1.6% is work backward to define how many shares to buy – the original question of risk management.
We’ll buy ANZ at $33.00 with a stop loss at $32.00. Therefore,
1.6% of our $100,000 account is $1,600
$1,600 / ($33.00 – $32.00) = 1600 shares with a value of $52,800
And for XYZ, buying at $0.20 with a stop loss at $0.18. Therefore,
1.6% of our $100,000 account is $1,600
$1,600 / ($0.20 – $0.18) = 80,000 shares with a value of $16,000
Immediately you can see that in order to equalise risk we need to buy vastly different numbers and values of shares. Remember, we’re equalising risk – not equalising the value of capital allocated to the trades. This example clearly shows the major shortfall when trading equities with this technique, i.e. we need to allocate half the account to facilitate the ANZ trade – the answer to that however is going to need to await for another time.
So if ANZ gets stopped out at $32.00 we lose 1.6% of our account balance. If XYZ gets stopped out at $0.18 we will also lose 1.6% of our account balance. Risk has now been equalised.
How many trades in a row can we have before we can’t trade anymore? In excess of 150…
The reason is that because we’re always risking 1.6% of our capital. This will ensure we’re risking less dollars as our account declines. 1.6% of $100,000 is not the same dollar amount as 1.6% of $90,000. So as losses mount up it becomes harder to lose money. It’s a natural defensive mechanism.
And when we’re winning, we naturally compound the account. 1.6% risk on $100,000 is not the same a 1.6% risk on $110,000.
When doing something right – do more of it. When doing something wrong – do less of it.
When we look at some hard data we can see a well defined difference. Below are the statistics and equity curves using the exact same trades – the difference is in the position sizing used. Risk Model A allocates a fixed $5,000 to each trade, whilst Risk Model B allocates a fixed fractional 1% risk to each trade. The latter grows at a much healthier rate, 3x the rate in fact, albeit it shows a little more volatility. Risk Model A, the fixed dollar allocation, is what many novices do.
Sure, it works. But it’s not optimal.
Note also the commission drag – Model A needs to make a lot more just to cover commission costs than that of Model B.
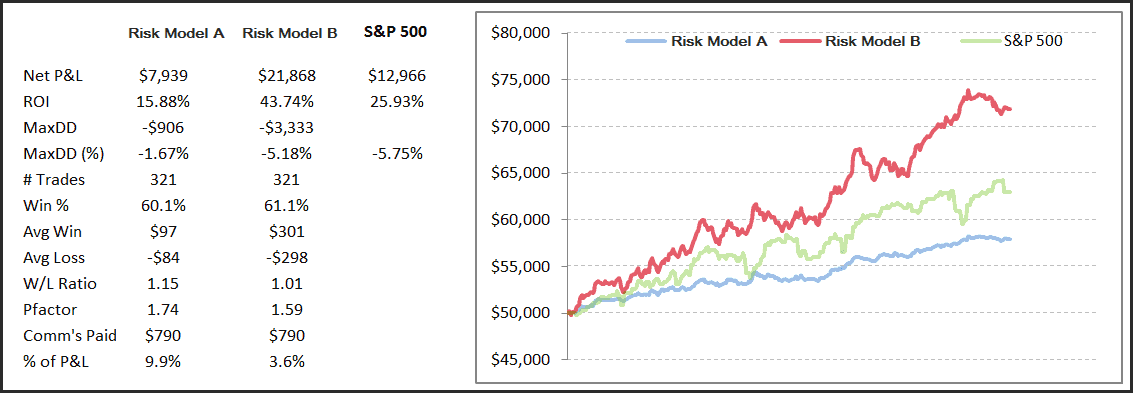
If you enjoyed this article, then why not take a look at our no-obligation trial membership. Risk Model B above is the exact trades from our US Power Setups Discretionary Portfolio – one of many portfolios we offer clients.
![]()