Changes and Upgrades at The Chartist
Over the past few months, we’ve been hard at work on new features across The Chartist site, and I’m excited to announce the first wave of these are now accessible.
The best part of this is that all of these new features come at no extra cost to your current membership plan.
Discretionary Portfolio Retirement
As we shared last week, Craig is heading into a well-earned retirement. With that, we’ll be moving all of our discretionary trading into the (redesigned) Chart Research areas.
Over the next few weeks, the US and ASX discretionary service trades will be managed out to their natural exits, with exit signals provided exactly as they always have been, so each position runs its full course.
But while the short-term discretionary portfolios are winding down, the discretionary trading techniques behind them aren’t going anywhere. The newly redesigned chart research section will continue to offer daily in-depth, high-quality discretionary analysis and trades. Pair this with our new Portfolio Tracker, trade charting, and other tools, you have everything you need to power and grow your discretionary trading.
Trader’s Toolbox
Our new trader’s toolbox section features a number of tools to enhance and assist you in your day-to-day trading, including our new portfolio tracker, upgraded momentum briefs, and new heat map (more on these below).
There’s more to come here so keep an eye out!
The Chartist Portfolio Tracker
![]()
Our new Portfolio Tracker is now in Open Beta. We’ve been gathering lots of useful feedback over the last few months from our beta testers, and we’re now ready to open access to our wider membership. With the Portfolio Tracker you can:
- Log, track, and manage your trades and strategies (Chartist and non-Chartist strategies!)
- Visualise and chart trade positions from global market data, including North American, ASX, European, and Asian stock markets; Forex; and Cryptocurrencies.
- Understand portfolio composition and FX exposure.
- Receive a daily summary of your trade movements at the end of each day.
- Calculate performance at the individual strategy level and portfolio level.
- Import transactions via broker exports or directly with IB Flex Queries.
Find the Portfolio Tracker under the Trader’s Toolbox category in the dashboard menu. Current users of Share Trade Tracker can import their whole trade history in.
Trade Charting and Visualisation
Clicking a trade row on any of the portfolio pages will now open a popup charting that trade with entry and exit points marked where applicable. Use your arrow keys or the buttons at the top to quickly scroll through charts of a portfolio’s positions.
Try it out now: open a strategy page, and simply click on one of the entry rows to see the chart, then use your arrow keys to flick through the charts. Here’s the chart of Micron from the Trade Long Term portfolio:
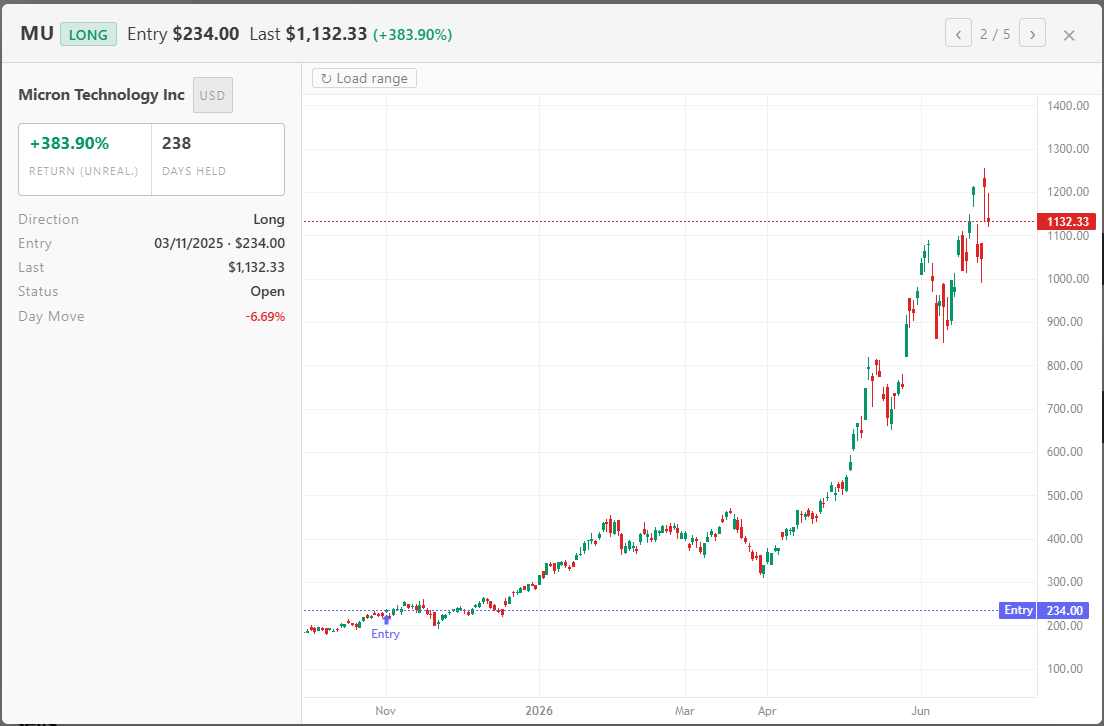
Chart Research Redesign
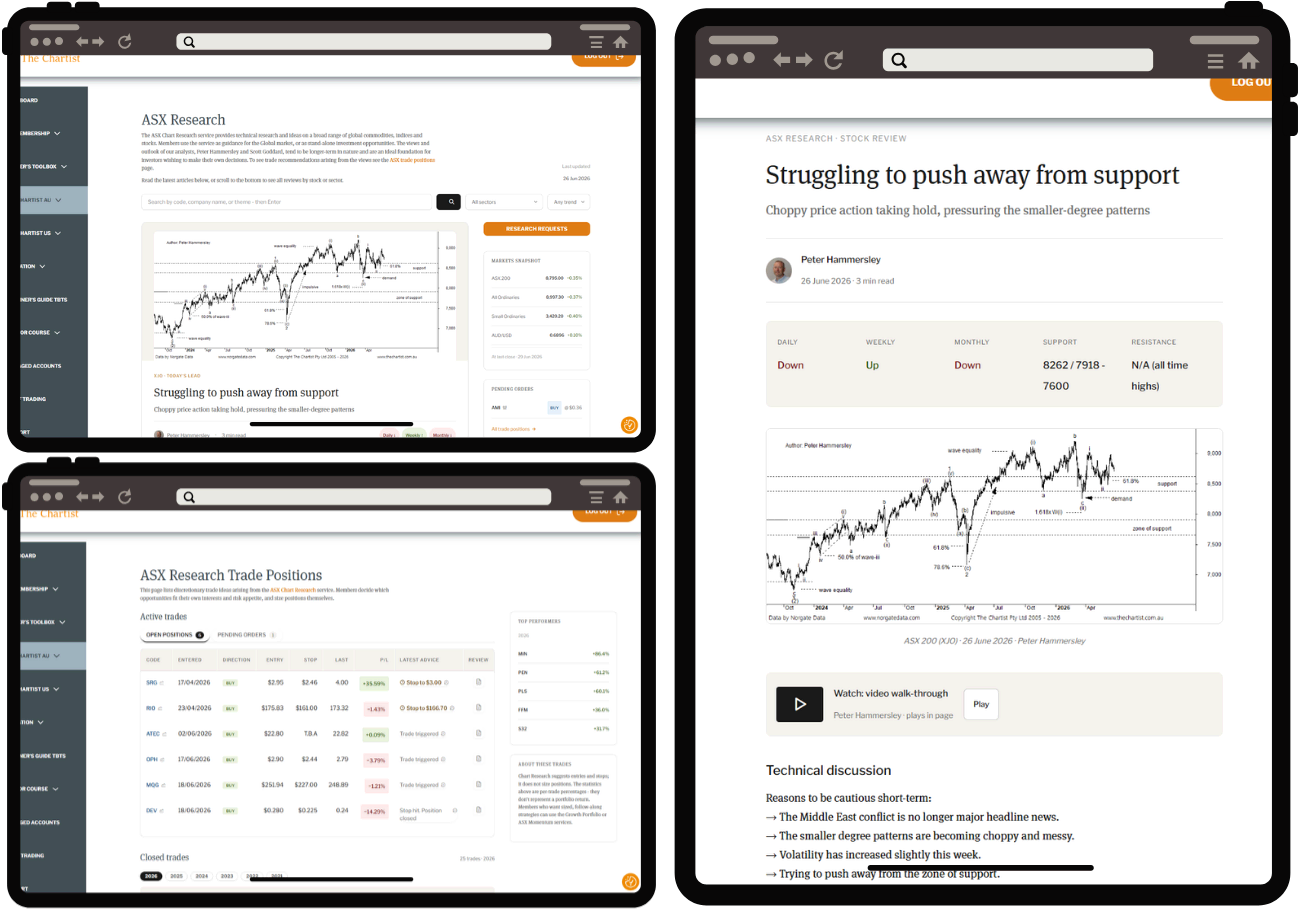
Discretionary trading will now live in the ASX and Global Chart Research sections which have been completely overhauled. The redesign focuses on readability and ease of use, so you can get the most out of the fantastic research from Scott Goddard and Peter Hammersley.
Whether you trade the positions directly or use the research to assist and inform your trading decisions, this redesign is sure to improve your process dramatically.
Try it out now: open up the ASX or Global trade positions pages, on the open positions, click the ticker code to open the trade chart, or click the document icon at the end of the row to read the latest review!
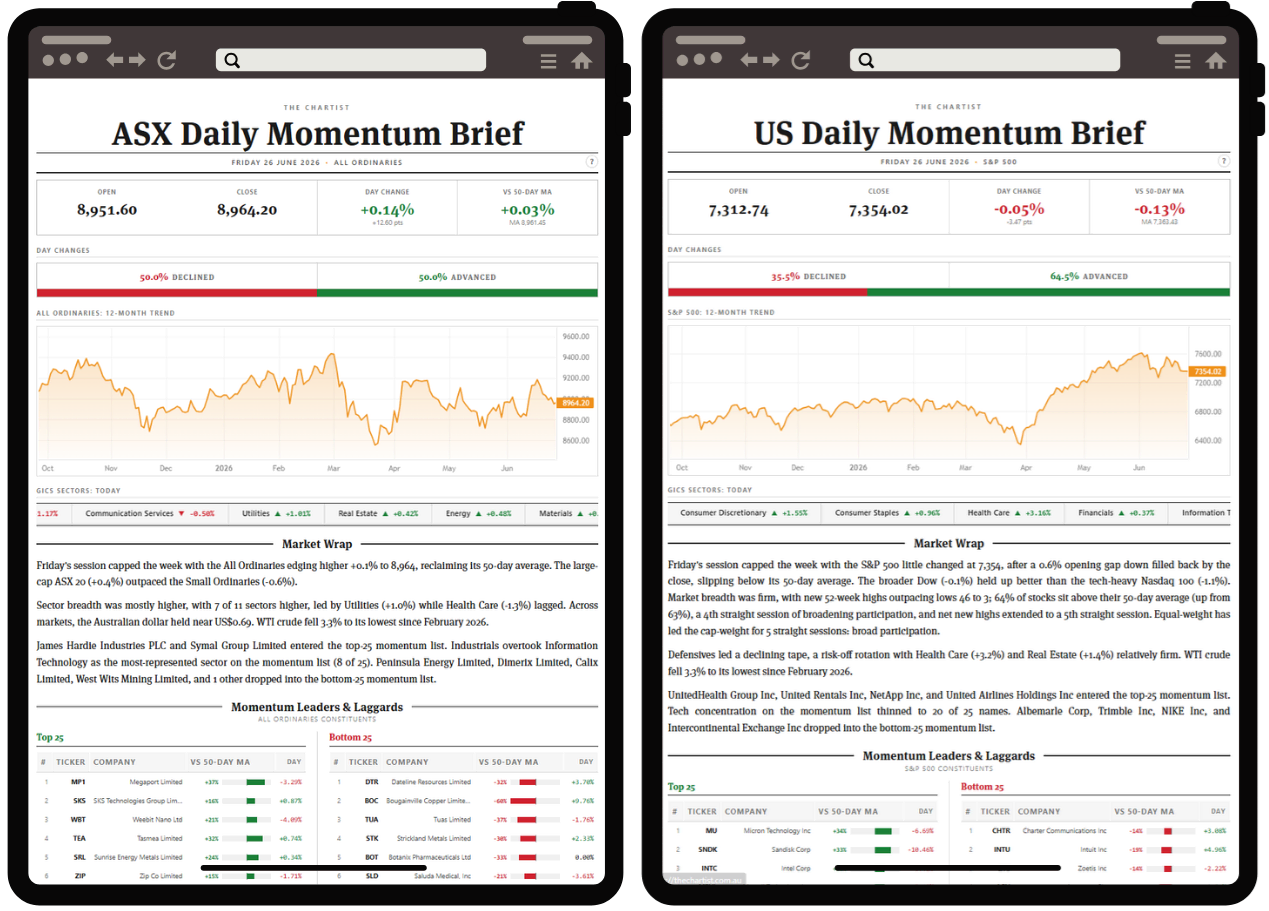
Upgraded Daily Momentum Brief
The daily momentum brief has undergone a complete overhaul. Receive a daily brief at the end of each market session, summarizing the day’s moves, including the leaders and the laggards. Use the top and bottom 25 lists to see where momentum is concentrated or to inform your own discretionary trades. Click on any of the stocks or sectors to see it charted with momentum stats. Access the ASX here or the US here.
Try it out now: Open up the ASX here or the US here, read the day’s wrap, then click on one of the top 25 stocks to see it charted, then use your arrow keys to flick through them quickly (great for finding setups).
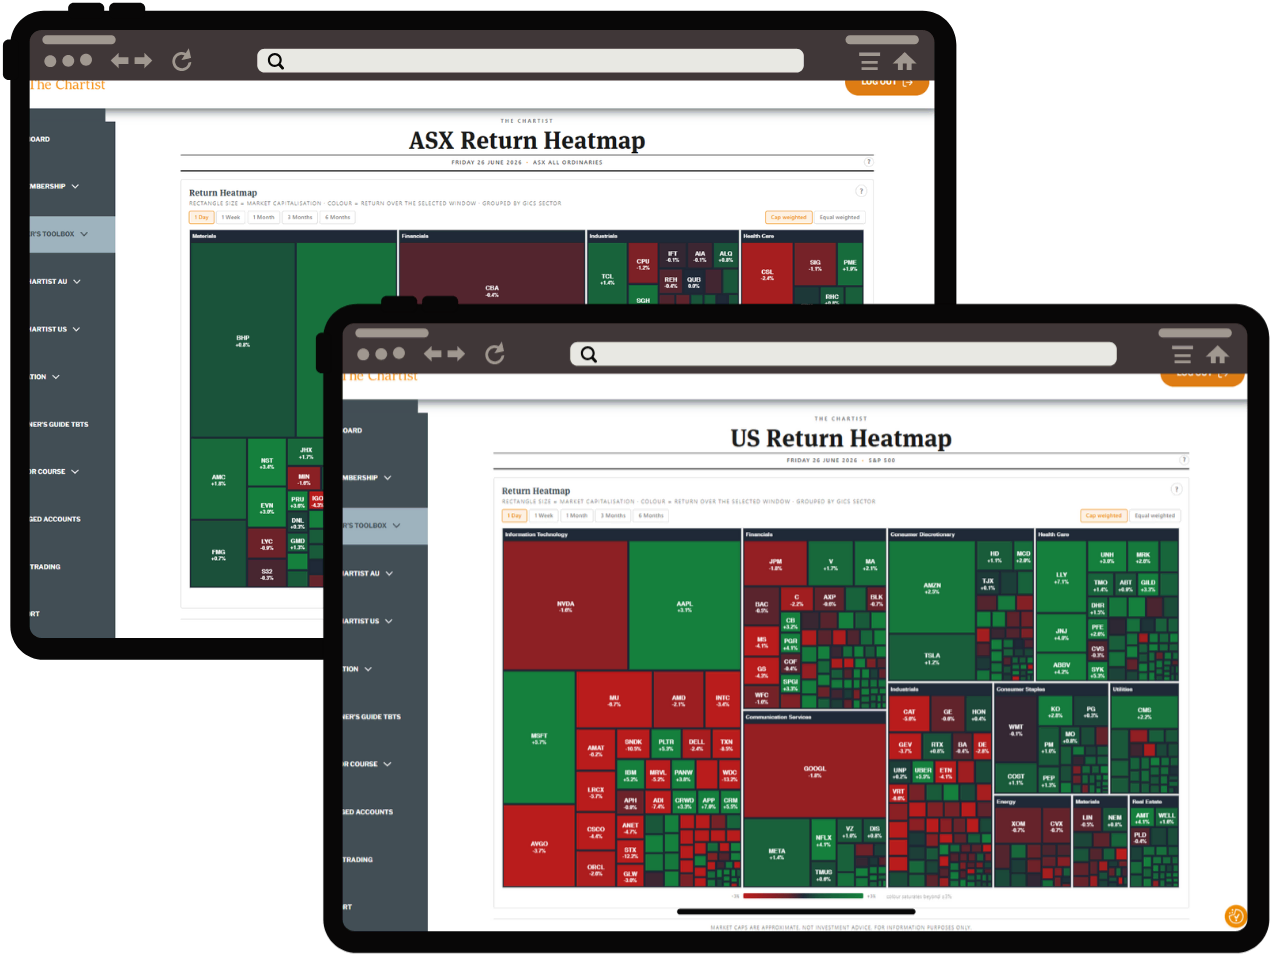
New ASX/US Heat Maps
One of my personal favourite tools to get a quick read on the market moves: the heat map. Visually see the performance of all the S&P 500 or ASX All Ordinaries constituents across the day’s session, prior week, months, etc. Change the grouping from cap-weighted to equal-weighted to see whether a rally is broad or dominated by mega-caps or certain sectors. Click any of the boxes to see that stock chart. Access the ASX here or the US here.
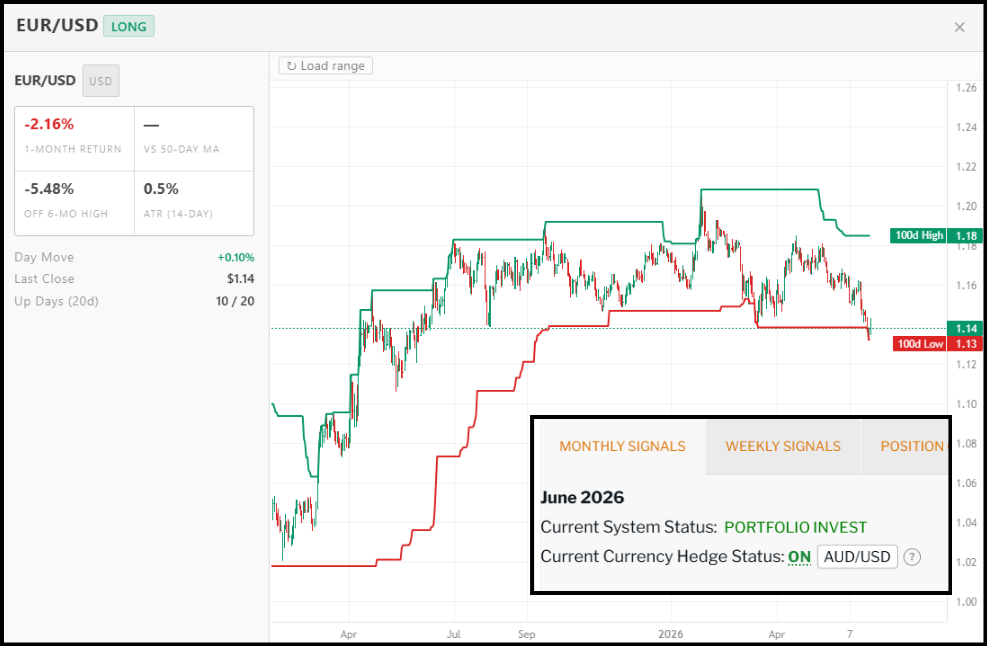
Currency Hedge Status is Now Multi-Currency
For those trading the US portfolios from outside the US and wish to hedge against currency movements, our Currency Hedge Status indicator now includes AUD, EUR, CAD, and GBP.
Click the currency pair dropdown to change the hedge currency, then click the ON/OFF status to view the FX chart. If you’re not sure about how this works or whether hedging is for you, click the (?) next to the hedge status indicator.
NOTE: the currency hedge status indicator is absent from the High Frequency portfolio page as it is by nature a very short-hold portfolio.
As always, if you have any questions or concerns feel free to reach out via email or the contact forms on the dashboard.
Best Regards,
The Chartist Team