The Chartist’s 2009 Underground Buy Signal
The Chartist’s Underground Buy Signal contained in their Special Report was intended only for members of The Chartist.
How A Major Brokerage House Found Divine Foresight During The Darkest Days of the GFC
At 1.45am on September 15, 2008, the massive global financial services firm Lehman Brothers collapsed. Thousands of clients and investors lost billions of dollars. With it the worst financial crisis since the Great Depression was triggered. Months would pass before global stock markets calmed and much longer before investors had the nerve to invest in shares again.
Yet, unbelievably, in the midst of the panic and hyperbole, at the absolute darkest lows of the GFC in March 2009, there was a very small group of brokers tucked quietly away within another large investment bank that were buying shares en-masse for their clients – and they had good reason to…
The Underground Buy Signal That Triggered In March 2009
The damage inflicted by the GFC was unprecedented over the last 70-years. Global stock markets fell by 55% and in doing so obliterated the revered Buy and Hold strategy brokers and financial planners place so much emphasis on. In fact, according to Morningstar (provider of independent investment research) some 95% of US Mutual funds lost more than 27% in 2008 alone. Some funds lost upward of 50%.
As you can imagine, the last thing anyone wished to do was buy shares.
So why was this small group of brokers buying shares for clients en-masse in March 2009…?
Because the Underground Buy signal that triggered in March 2009 was the same signal that triggered a Sell in March 2007. Here is a snippet of 6-page Special Report “The Australian Share Market – A Significant High” delivered to Chartist clients in March 2007:
Brokers and Financial planners weren’t going to admit it, but their business models were coming unstuck. Many had retained the traditional stance – keep their clients buying all the way down, yet not knowing that the bottom was beyond anything they’d ever experienced before.
They were now trapped. Their clients had lost faith. They required new information. Insightful. Original. Non-traditional. More importantly they required it to be based on a historical record of strong forecasting and analysis skills.
Skills that traditional stock broking firms simply don’t have.
The Chartist 2007 Special Report contained extensive charts and research dating back to 1950 that outlined a detailed description of how groups of people behave. In it, The Chartist showed how mass psychology swings back and forth from optimism to pessimism and in so doing creates consistent and repeated price patterns. Once these patterns are identified correctly an investor is able to position themselves to profit from forthcoming price movements as well as build an appropriate risk mitigation strategy.
And because The Chartist was able to tap into and uncover these destructive price patterns in 2007, clients were easily alerted to the extremely bullish March 2009 Underground Buy Trigger. But then it all changed…
Brokers Illegally Stole and Distributed The Signal
It was a perfect Autumn day in early March 2009 when the call came through. A slight breeze and glorious sunshine. A group of independent professional traders were taking on the challenging Hyatt Coolum golf course situated on Queensland’s Sunshine Coast. The urgent call, from an insider at one of Australia’s largest banks, alerted Nick Radge, Head of Trading and Research, that the breakthrough research report distributed to its own clients just days prior had been leaked. It was now being illegally sent around to thousands of the banks clients.
The Chartist March 2009 Special Report, “The Australian Share Market – A Significant Low”, detailing the Underground Buy Signal had the brokers in a frenzy.
They had been hunting for evidence. Grasping at any fundamental straws that had some hope and promise. Looking for reasons to get their clients back and buying shares again.
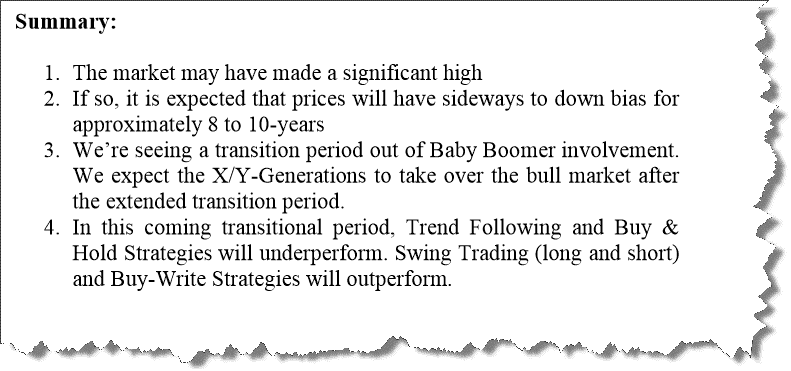
They needed to save themselves but to do so they needed the highly technical research and resources of The Chartist. Below is a snippet of expectations in March 2009:

As part of the Special Report The Chartist detailed 7 of Australia’s largest companies to buy and retain for the coming advance. These included: BHP Billiton (+58.9%), Suncorp (+66%), Wesfarmers (+78.8%), Woodside Petroleum (+65%) and Westpac Banking Corp (+78%).
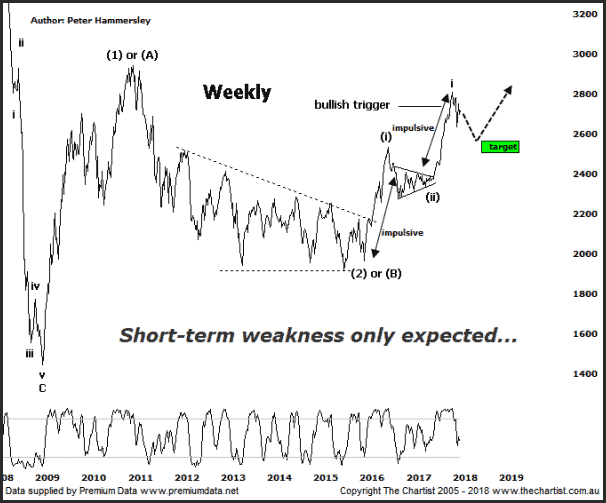
| The Australian All Ordinaries Index (XAO) showing the March 2007 and March 2009 major market highs and lows and Underground Signals. A key expectation for The Chartist Underground Buy Signal was a rebound of at least 50% of the prior decline. This occurred within 12-months when prices surpassed 4981.
This chart research also shows the two Intermediate Signals generated by the team at The Chartist.
|

Chart Research for Self-Awareness
The stock market is based around human emotion: more specifically fear and greed. You see, while the economy may change, while companies may come and go, human emotions have ALWAYS remained constant.
But while you want to invest based on the emotions of the market and how fear and greed are influencing people to react, the key to becoming a successful trader or investor is to take your own personal emotion out of the equation.
Why?
Because make no mistake – the “Big Bad Wolf” in trading is fear and greed. He’s ruined thousands of traders over the years – and if you let him control your trades, you’ll probably end up as his victim too.
But the problem is there is so much noise in the marketplace.
You get different advice from the newspapers and magazines you read. Then you flick on the television and watch CNBC and some expert is telling you something else. And then you receive a call from your stockbroker (who gets paid by how many trades you make, not how much money he makes you) and he’s telling you something else.
So what’s the trick to maintain your confidence and focus regardless of the noise?
It all boils down to strong research, identifying a plan you trust, and then sticking to it.
The Chartist’s Chart Research is used by traders, investors, options and CFD users to identify chart trends across the world, including:
√ Australia’s largest companies
√ Leading indices and sectors on the Australian stock market
√ Global stock markets, including the United Stated, Europe, Asia and China
√ Commodities, such as Gold, Silver, Iron Ore, Wheat, Soybeans, Cotton, Crude Oil
√ Foreign Exchange majors
If you currently receive broker research, or subscribe to fundamental software, such as Stock Doctor, then the addition of powerful chart research delivered daily by The Chartist will only increase your investment and trading abilities.
PS:- CLICK HERE to read what Marcus Padley has to say about combining fundamental and charting analysis.