Combining Trading Strategies to Diversify Your Portfolio
Combining Trading Strategies to Diversify Your Portfolio has sparked a question from one of our subscribers.
A recent question from Julie B…
Have you run a test where you allocate equal amounts to [turnkey strategies]? If so, can you share the resulting data?
Long time readers will be aware that I’m an avid proponent of diversifying across various systems. Indeed I trade 8 systems currently that encompass various styles, time frames and geographical markets.
Julie’s question is appropriate for those that may not have the time or capabilities of designing, building and testing their own strategies.
For this example we’ll combine the following turnkey strategies:
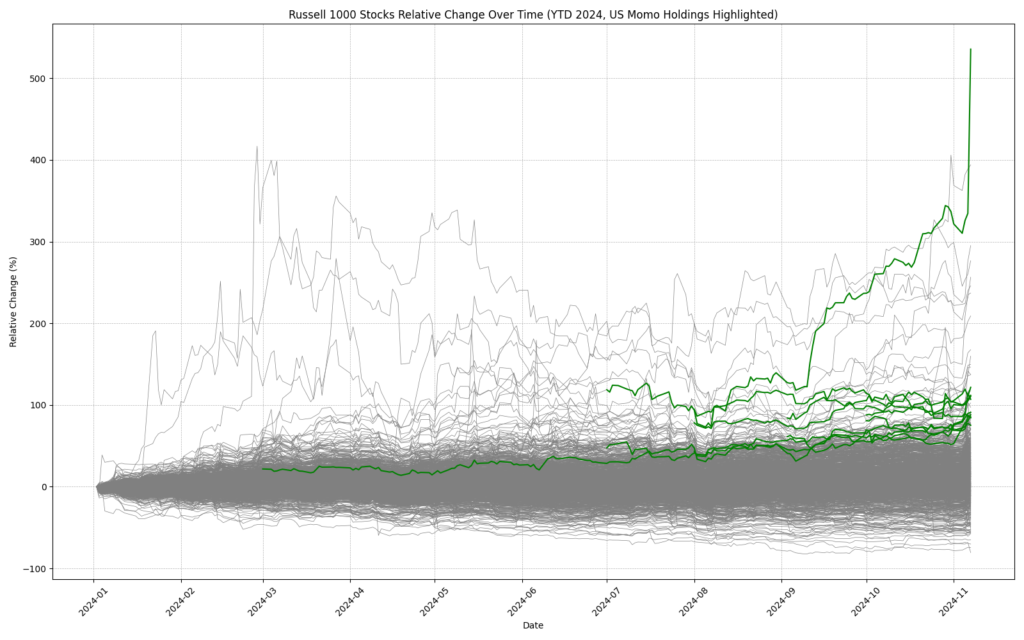
- Large Cap Momentum
- Weekend Trend Trader
- Mean Reversion
- Day Trade (Long)
We’ll use the default settings as per the performance test notes of each strategy. For ease of comparison, this test has only been conducted on US markets to alleviate any currency movements. No margin has been used.
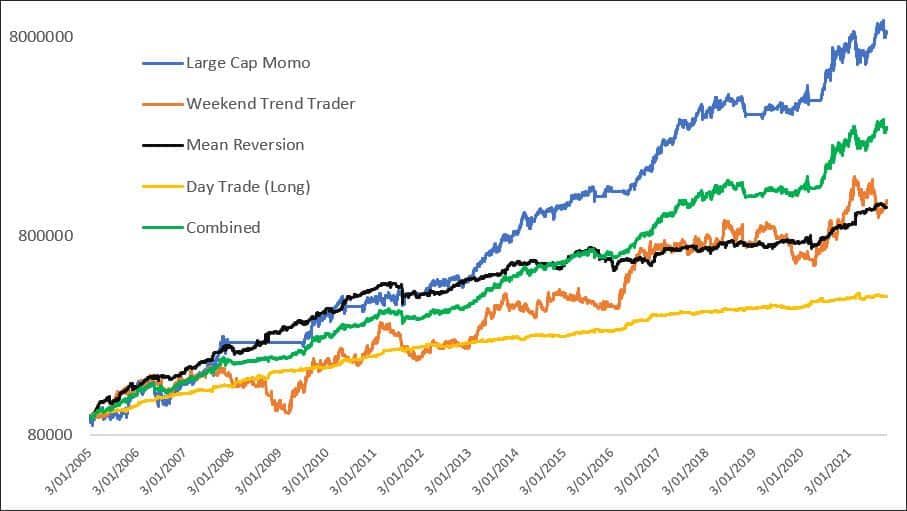
Equity Chart
The following equity chart shows the growth of each strategy and the combined strategy. Whereby the capital was equally divided into 4 parts.
The combined equity growth (green) is certainly smoother, however there are some caveats.
Firstly, no re-balancing has been done. Ideally each portfolio should be re-balanced at least once a year. I would expect this will greatly enhance the risk/adjusted return and the smoothness of equity growth.
Secondly, the day trade strategy was designed to be used with leverage. Which is why it “appears” to underperform here. In the real world, assuming leverage is not used, one would weight the allocations according to the strategy volatility. As such, the Large Cap Momentum and Weekend Trend Trader would get lower allocations. The Mean Reversion and Day Trade strategies would get higher allocations.
![]()