Technical Analysis: Essential Exit Rules
When new participants enter the speculative arena, most time is generally spent using technical analysis to look for a high probability entry technique. Technical analysis is the use of price, volume and chart patterns to make trading and investment decisions. Amateur traders believe that with a ‘sure-thing’ entry technique, profits are sure to follow. This could not be further from the truth. I’m sure you realize that the ‘Holy Grail’ does not exist and yet, how many hours do you currently spend looking for that perfect entry or indicator?
Before moving on, I would like you to ponder this table:
| % WIN | Trades | AvgeWin | AvgeLoss | Profit | |
| Trader 1 | 75% | 100 | $800 | $2000 | $10,000 |
| Trader 2 | 50% | 100 | $800 | $600 | $10,000 |
| Trader 3 | 25% | 100 | $800 | $133 | $10,000 |
Although this table is usually used to show the importance of money management, it can also be used to show the unimportance of entries. Trader 3 can make just as much money as Trader 1 even though the winning percentage is only 25%. It can also be a fair assumption that most profitable traders use completely different entry techniques. Based on the assumption that entries are not the common denominator, what is it that then that makes them profitable?
The basis of profitable trading is two-fold:
1. The average dollar win is greater than the average dollar loss, and
2. Wins outnumber losses
Generally speaking, the shorter the trading timeframe the closer the average dollar win/average dollar loss ratio. An example of this type would be day-traders. They risk $1 to make $1. They have the ability to quickly exit when the trade moves against them and generally with this speed they are able to win more often than not. In fact, to have an average dollar win/average dollar loss ratio of 1:1, you must get it right more than 60% of the time in order to make money. I can assure you that winning at this rate is difficult, and in fact a more realistic rate would be closer to 40 – 50%.
Therefore, by increasing your average dollar win/average dollar loss ratio to say 4 or 5:1, you could then expect to be quite profitable assuming a win rate of less than 40%. Very quickly the association of profitable trading with a high probability entry system is reduced dramatically.
That assumption aside, how is it we can achieve an average dollar win/average dollar loss ratio of greater than 4-5:1? This is where trade management becomes important. Trade management is made up of money management and exits and is critical to increasing profits and decreasing losses.
Using technical analysis we can define four basic forms of exiting the markets effectively:
1. The Initial Stop
2. The Breakeven Stop
3. The Trailing Stop
4. The Exposure Stop
The Initial Stop
All types of businesses require an outlay of some description in order for profits to be generated. Trading is no different. You must be prepared to risk money in order to profit. The secret here is to limit those risks and keep them as a fraction of the potential profits. The initial stop limits our losses if the trade goes immediately against us and also serves as a trigger to act automatically. The stop should ideally be placed at a technical level, i.e. below/above support or resistance. The stop level should be a part of your trading system and not a random point that differs on each trade. The stop level is arbitrary to some extent, but it MUST be placed.
* Always place the initial stop prior to entering the market, and
* Never adversely move the initial stop after placing it
The thought process at this stop level can influence people in many different ways. The one over-riding mindset is to remove the stop altogether and hope the market will return to our entry price and let us out without a loss. I can guarantee that your mind will negotiate as hard as possible with you to move this stop a little further away. Moving your initial stop in the belief that a reversal is apparent is a sure fire way to increasing your average dollar loss. An increase in the average dollar loss will destroy profitability on any trading system. Cut your losses, cut your losses, cut your losses…
The Breakeven Stop
It’s very easy to make trading a two-sided equation; accept a loss in order to make a profit. However, the next step is to protect our original capital before thinking of the profits. Once our capital is theoretically protected, we essentially have a free trade. A free trade is theoretically ‘free of loss’ as well as ‘free of anxiety’. If you can conceptualize that the trade will not lose any money, then you may learn to accept that it can now move freely into large profits and without your emotional input. You should become more patient with the trade now that the risk has been theoreticallyalleviated.
* Move the initial stop to breakeven (commissions included) once the market has moved twice the distance of your initial risk
Example: Long the SPI at 3010 with an initial stop at 2990 (20 ticks). Therefore, once the market trades to 3050 (2 x 20 ticks), move your stop to 3010 to protect your capital. You are now free to let the market move without the fear of losing your own money. By letting the market go twice the initial risk, we are making sure that a false break or normal market noise will not prematurely take us out of the trade.
I can see you’re now saying “you’re kidding Nick, with the SPI at 3050; I’d be taking my well earned profit!” Let me assure you, the only way to get a reward to risk ratio of > 5:1 is by giving the market breathing room. You will never make large profits by taking small profits.
The breakeven stop has a second component:
* Move your initial stop to breakeven, or as close to as possible, after 4 days
Does the word “hope” ring true to anyone here? Professional traders don’t have “hope” in their trading toolbox and nor should you. If a trade does not perform within a preset time frame, move the stop to as close as is possible to breakeven. You are effectively forcing a result; your stop being hit resulting in a smaller loss, or the market moving in the desired direction. Either way you get a result and more importantly, those rubbish trades don’t end up in the “hope” file in the bottom drawer. Don’t tie up your capital on non-performing trades. Get a result or get out.
The Trailing Stop
“You will never go broke taking a profit”: possibly the most incorrect piece of advice I have ever heard. Unless you have a win rate of greater than 70%, taking small profits will mean that you will tread water for a very long time and possibly make you gear-up your risk to dangerous levels. You can make large profits with small risk by following the weekly trend. You just have to stay on that trend as long as possible. If you take consistent small profits, you will never allow yourself to make big profits. You only need make few large profits per year to be a highly profitable trader and the only way for this to occur is using a trailing stop to follow the market up. Nobody can predict the future. Prediction is an exercise in ego. Those who sell themselves as “Guru” forecasters are generally hoaxes with no statistically sound trading record and those whom follow without regard for sound trading principles are blinded by their own ego. Listen to the market and go with the flow of the market. Most great traders are trend following in nature.
So, how do you follow the trend? I will outline two methods; one for share markets and one for commodity markets. Why the difference? Sharemarkets tend to “backfill”, that is, they tend to move in fits and starts. It’s important in these circumstances to be patient and go with the ebbs and flows. This ebbing and flowing is simply minor swing highs and lows within the overall weekly trend. Consider this chart:
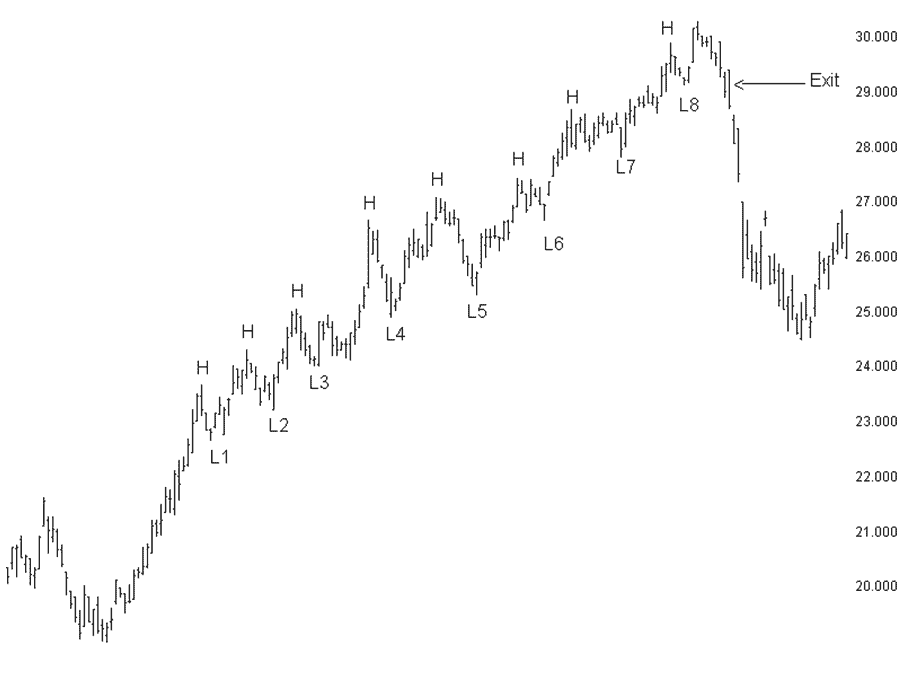
In this particular chart, the large uptrend is plainly evident. It’s also easy to see the market ebbing and flowing within the trend. Getting into tune with this price action using the swings allows a mechanical way to follow the market and allows profits to be maximized in line with the trend. The swing highs are identified with “H” and the swing lows with “L”.
Very simply, when a market retraces from a swing high (H) to a swing low (L) we have the setup to move the trailing stop up. Once the preceding swing high is broken, move the stop to 1 tick below the swing low (L). In the above chart, this would have been done eight times. Each time H was exceeded, the stop got moved up. We are tuned in to the ebbs and flows of the price. In reality we have no preconceived notions on how high it can go and therefore we are just along for the ride.
The next method is generally used in faster moving markets such as commodities. In these situations the markets tend to have prolonged moves without retracements. By applying an exponential moving average, we can track the faster moving markets and at the same time give them some room to move. The difficulty herein lies in your personal appetite for leaving profits on the table. If you have a low tolerance, use a smaller lookback period, say 7 to 12 days. If you are very comfortable giving the market breathing room, use a slightly longer period, say 15 to 20 days. Don’t kid yourself here: we are looking for bigger moves and as a result we must allow the market some room to move. Consider this chart:
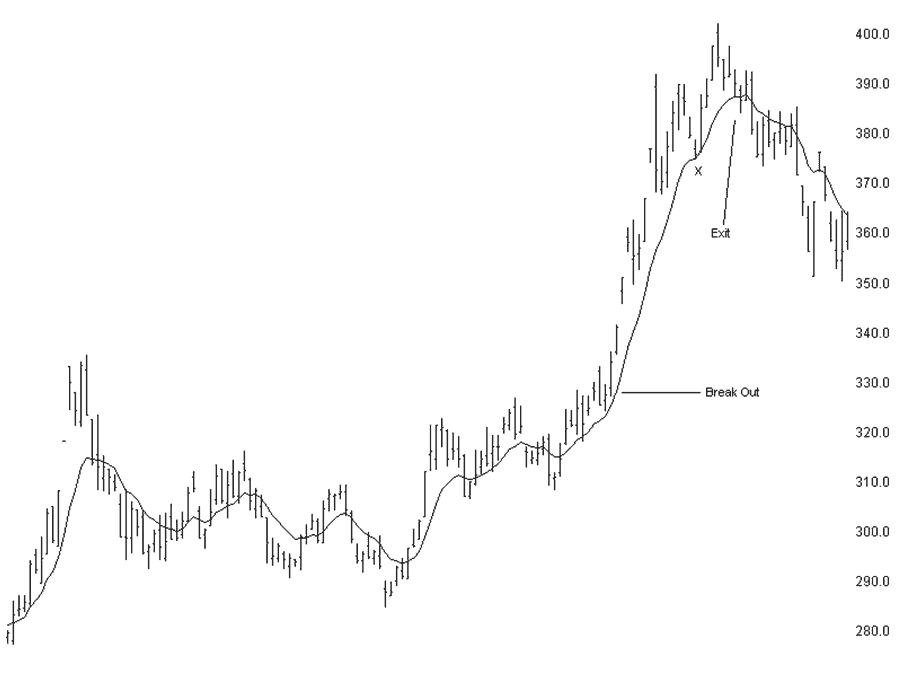
You can see the risk reward payoffs using this method. This is what I personally use when trading futures. The important thing to remember is that the same length EMA must be used on all markets. Changing the length effectively changes the chart to fit with your current emotional stance. By using the same length lookback you are automating your trailing stop regardless of the data. In this way you are then able to quantify the effectiveness of the trailing stop and the impact on the overall efficiency of the system as a whole. Using Trade Efficiency calculations, you can obtain accurate data on how much profit you are actually making based on the total move. Remember, we are using hard statistics to determine the effectiveness of the trailing stop, not our emotional responses.
The Exposure Stop
I have covered almost all market situations; an immediate move against your position, a non-moving market and a trending market. An area almost always overlooked is the definition of a windfall profit. Why is this important? It’s normal for the amateur trader to get anxious when making money and even more common for them to take the quick profit whilst its there. Let’s face it, it may disappear right? Wrong! As mentioned above, you will never make large amounts of money by taking quick profits. However, if we carefully define a windfall profit in relation to our account equity and position risk, then we can prudently capitalize on explosive moves. It’s prudent to do this because after an exponential move caused by fear and excitement in the market, there is a high probability that the market may retrace just as fast. This method will smooth your equity curve and lower your anxiety because you are prepared to act upon any price action.
I personally define a windfall as 10 times my initial risk. That is, if I risk ½% on any trade, it must go above my trailing stop by 5% of my total account equity. It rarely happens but it can happen. Here is one such move:
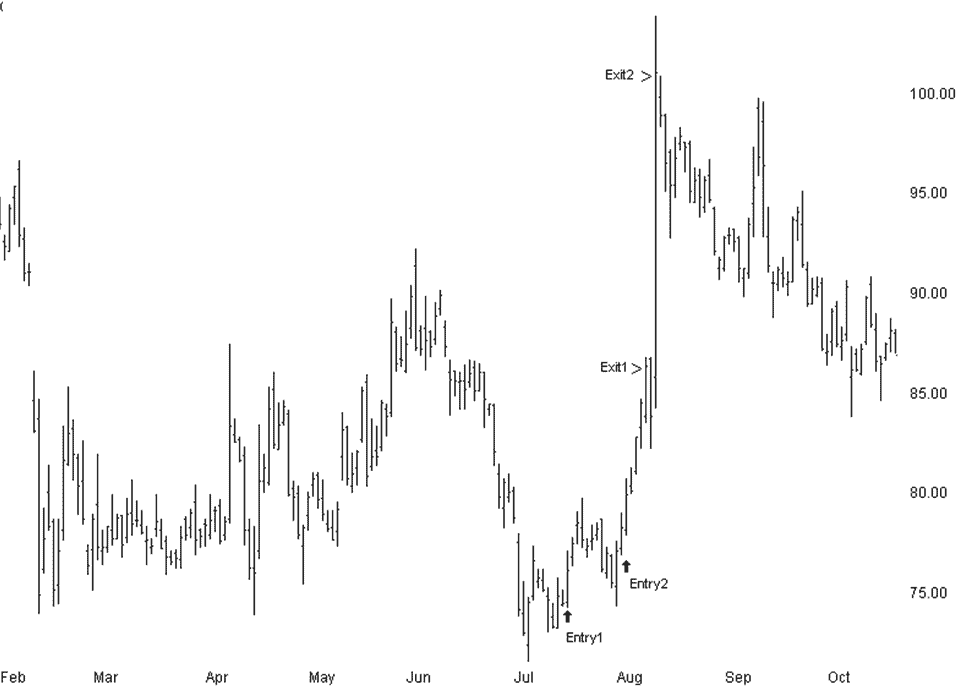
Exit 1 was a function of the trading program. Entry 2 was a function of prudent money management. I defined the distance that the market would have to travel that would return 5% on the account. As you can see it was a fairly decent move. The calculation must be based on the risk of the trade and the percentage return on the account. Define a windfall profit to suit your own personality but don’t kid yourself. It shouldn’t happen on every trade. If it does, your risk is out of proportion to the profit or you are falling into the trap of taking the quick profit.
An important rule is to consider why the market has made this move and then consider the consequences. If a major change had occurred which will dramatically affect the underlying fundamentals, it may be prudent to only take partial profits. If the above move were because a tornado hit Florida and destroyed the Orange Juice crop, I would not have taken any profits. In that instance, Orange Juice could’ve only gone one way! However, what actually occurred was a rumored crop report that had no substance. The market has just pre-empted a bullish report and a combination of excitement and stop-loss orders created an exponential move. My trading plan involves these criteria and I acted according to that. A simple, yet prudent, rule.
In summary
I have used technical analysis to outline what appear to be simple rules. When applied correctly and with discipline the trading process becomes more controlled and therefore decreases anxiety. You have the ability to react to any situation that occurs because you have prepared for that situation. We have taken the process of high probability entries away and therefore the need to be correct. The need to be right or wrong should not be included in the trading process. I don’t trade to be right or wrong and being wrong does not bother me. I trade for profits. Trading with the trend and prudent exit criteria allows profits without the need to be right more than 40% of the time.
If you would like to learn more about technical analysis, consider my e-book Adaptive Analysis for Stocks. Take a look at our free trial and see this analysis at work with our Power Setups.
![]()