Silver and Gold – Chart Research
If you’ve been watching commodities at all lately, you’ve probably seen that silver is booming and like me are wondering what in the world is going on.
So to answer the question, I thought I’d hand over to our Chart Research guru Scott Goddard to take a closer look at both silver and gold, both of which have had open positions in the Chart Research for over six months now.
Chartist members gain access to daily chart reviews including video analysis and trading strategies, covering major indexes, stocks, commodities, currencies, and more. Take a free trial now to view the Chart Research section and our systematic portfolios.
Silver – 11th Dec
Bottom Line
11/12:
Daily Trend: Up
Weekly Trend: Up
Monthly Trend: Up
Support Levels: $46.20 / $35.00 (zone)
Resistance Levels: $66.66 (all time high) (Mar 26 contract)
Technical Discussion
Reasons to stay bullish:
→ price action turned impulsive post the April cleanout low locking in
→ our EW count continues to look for higher longer term
→ recent breather has resolved to the upside yet again
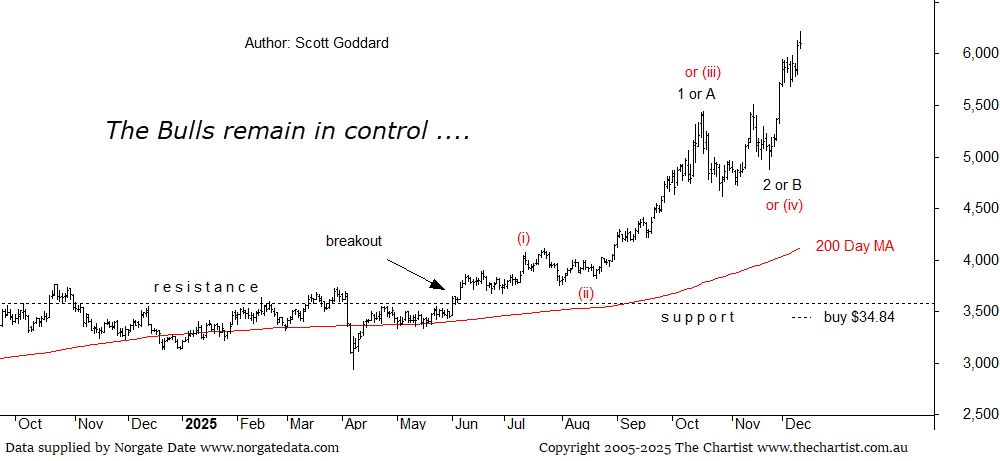
Silver prices surged to an historic peak on Wednesday, hitting $62.14 per ounce for the first time, supported by strong industrial demand, rising expectations of U.S. interest-rate cuts, and persistent supply pressures. Silver has now gained 110% since the start of 2025, outperforming gold and most major industrial commodities. Recent reports have highlighted several specific factors underpinning silver’s rally, including expanding industrial demand in electronics, solar energy and semiconductor manufacturing. Ongoing global supply-chain disruptions since August have further tightened supply, while renewed investor interest in silver as a hedging asset continues to add support. Silver-backed ETF’s also recorded their strongest inflows since 2020, adding 487 tonnes in November and over 475 tonnes since early December, signalling robust institutional interest.
No complaints here at all. The Silver futures contract remains under the influence of the Bulls with price now having surged well over the $60.00 milestone. From an Elliot Wave and positioning of the trend perspective, our preferred count is stating that we now have a Wave-3 or C in motion north which means the expectation is that price still has higher levels in mind here. To define this a little better, Wave-C vs Wave-A equality will target $73.81 whereas a Wave-3 1.618x the length of the Wave-1 extension move targets $89.30. The thing with the latter target is that this will only be locking in a Wave-3 high of an expected 5-wave move. So basis this, the possibility that $100.00 could be attained longer term is certainly not out of the question.
We do have an alternate red count on our chart as well that is also a possibility. What this is telling us is that a wave-(v) of 1 or A is now in play which will likely have a lower target than what we have stated above. Yet with the high only being a Wave-1 or A of either a 5-wave or 3-wave move north, then the targets we have stated above will still eventually be attained yet it will just take a little longer to get there. There is no doubting the Bulls conviction here with the Bears being completely outplayed at the moment.
To view the trading strategy and video analysis for Silver, sign up for a free trial now.
Gold – 9th Dec
Bottom Line
9/12:
Daily Trend: Neutral
Weekly Trend: Up
Monthly Trend: Up
Support Levels: $3630.00 / $3244.00
Resistance Levels: N/A (all time high) (Feb 2026 contract)
Technical Discussion
Reasons to remain bullish:
→ bullish decade-long cup & handle pattern target was achieved back in mid April yet we continue to look for higher
→ higher degree Wave-(5) now in motion north
→ watching to see if the Wave-(5) now subdivides into a 5-wave pattern within itself
→ larger cycle Wave-(5) of [3] or [C] high may have now locked in yet this is not our preferred stance
Central bank buying, fears of fiscal dominance and strong investment demand will drive gold higher in the second half of 2026, while silver is likely to see demand wane in key areas, but could still follow gold higher, according to a number of fundamental analysts. So they are seeing the first half of 2026 as relatively flat. Heraeus, who is a German, family-owned global technology group, founded in 1851 and specializing in precious and specialty metals, projects the gold price to trade between $3,750 and $5,000 per ounce in 2026. “The US has so far avoided the recession indicated by the Treasury yield curve uninverting last year; however, the labor market is weakening,” they warned. “The Fed usually favors supporting the economy, so if the labor market stays weak, more rate cuts will be forthcoming even if inflation remains above target. This reduces the real interest rate, which is typically positive for gold. However, after such strong price appreciation in 2025, a period of consolidation is anticipated before the rally resumes.” All speculative fundamental reasoning of course which can change direction at the drop of a hat as it normally does. Lets take a look at the technicals.
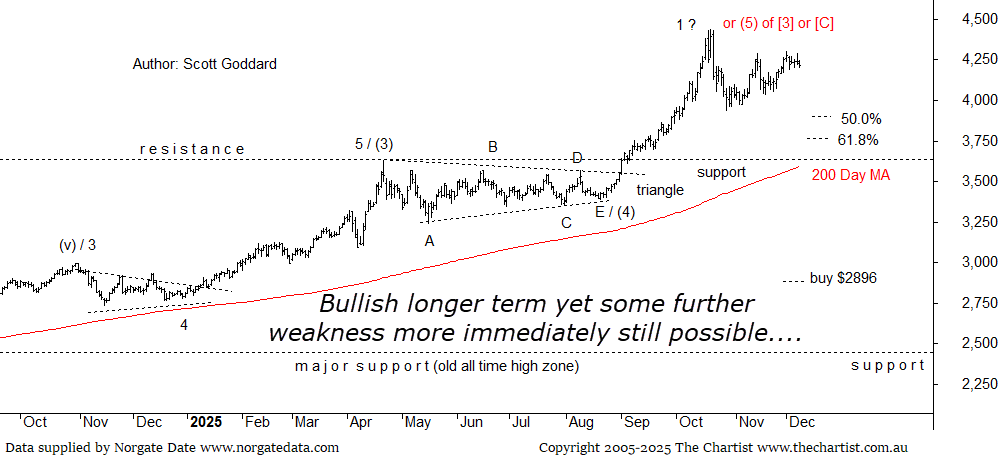
On the 21st October at the time of our last review we pointed out that the negative price bar witnessed in the previous session may well be the catalyst for some form of breather to start playing out. Ever since that review price action has clearly indicated it is now in corrective mode. Basis the recent choppy move north and the immediate hesitation being witnessed, I would not be surprised one bit to see price action remain weak over the coming weeks where another swing to the downside is being anticipated.
If our positioning of the trend is correct on our preferred count vs our alternate count (see video) the recent all time high that has locked in is only a Wave-1 of (5) of [3] or [C] with this immediate bout of weakness being an intermediate Wave-2. The thing with Wave-2’s is that they generally retrace 50.0% – 61.8% of the previous move north, and as you can see on our chart, price action has yet to tag these lower levels. Wave-2’s often unfold as (a)-(b)-(c) zig-zag patterns as well so for now now we continue to look for this pattern to play out which means some further weakness from here is going to be likely. The longer term bullish structures under such a scenario though will still be maintained, be it we need $3750.00 to continue to hold strong as part of this immediate corrective process. The next few weeks are going to be very telling.
To view the trading strategy and video analysis for Gold, sign up for a free trial now.