How Much Money Do I Need to Trade a Strategy?
The question of minimum necessary equity required to trade is naturally very common, especially for new traders. The starting balance of a strategy can be one of the biggest factors influencing rate of return, so it is important to understand how to set the importance of the decision. Unfortunately, however, the answer is not as clear-cut as you may think, and ultimately it depends on several moving factors.
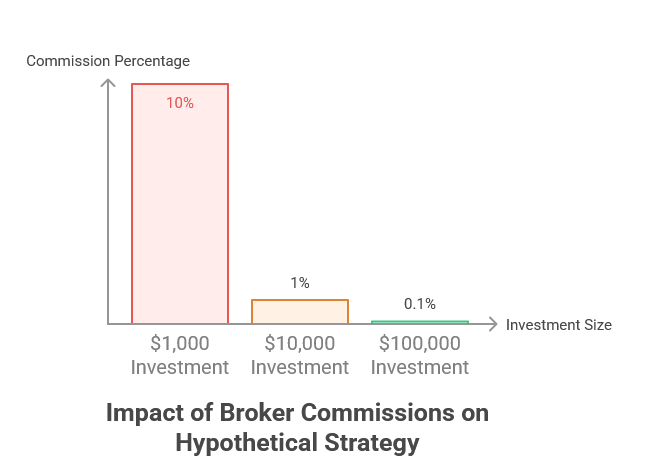
We can highlight the nature of the problem by looking at the following hypothetical trading strategy. Say you want to buy ten stocks, and you have $1000 with which to do so, so you divide your capital up into $100 portions. However, your broker takes a $10 flat-fee commission for every trade. So, for every $100 of stock you are purchasing, you are losing $10 on commission. Thus, you have lost 10% of your total capital at the very beginning of trading.
Obviously, this is extreme, so let’s take the same example but increase the initial investment to $10,000. Now the $10 commission on each trade equates to 1% of our capital, and we are in a better position to achieve positive returns. We can easily extrapolate this out to $100,000, resulting in a 0.1% loss for each initial trade.
However, most trading strategies aren’t buying and holding stocks forever; they’re rotating them out. And, with each rotation, we’re paying that commission, which means we lose that X% every single time. The more trades we make, the more commissions we will need to pay.
Thus, we can see that there is a three-way relationship between the commission pricing, the trade frequency, and the starting balance. If the commission fee increases, the starting balance must be raised or the trade frequency lowered. If the trade frequency increases, the starting balance must be raised or the commission lowered. If the starting balance can be raised, then we have room to increase both the frequency and the commission.
But what does this look like from a practical point of view?
We can run backtests on real historical market data to evaluate the effects of starting balance on our trade strategies. Let’s look at our ASX All Weather strategy, a low-frequency strategy that rebalances once a month. For a low-frequency strategy like this, we suggest using a flat-rate fee, such as SelfWealth, which charges $9.50 per trade.
To see the effect of the changing start balance, we’ll look at the exact same trade frequency and commission structure and observe the effect on the returns. You can see this in the chart below, which is shown in percentage terms, not dollars.
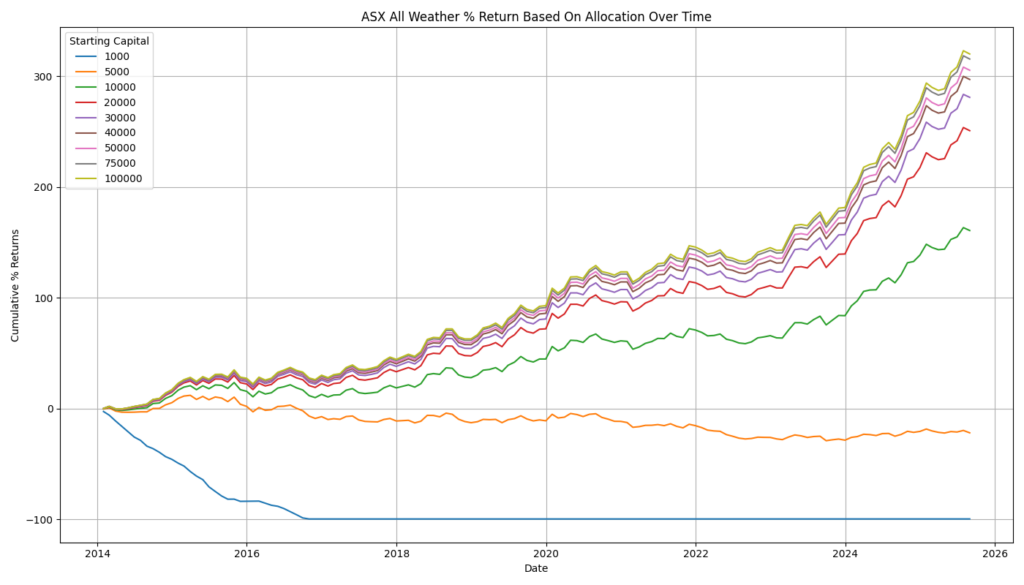
As predicted earlier, the $1,000 investment immediately loses capital and is never able to make it back, eventually losing the full investment fee. Similarly, a $5,000 investment struggles to overcome the commission drag and finishes at a loss. All returns from $10,000 upward are positive, with the cumulative percentage return increasing alongside the start balance.
However, as the starting balance increases, we can see the gap between percentage return begin to narrow. This is due to the fixed-rate commission becoming decreasingly significant as the starting balance is raised to the point that eventually it effectively no longer influences the return.
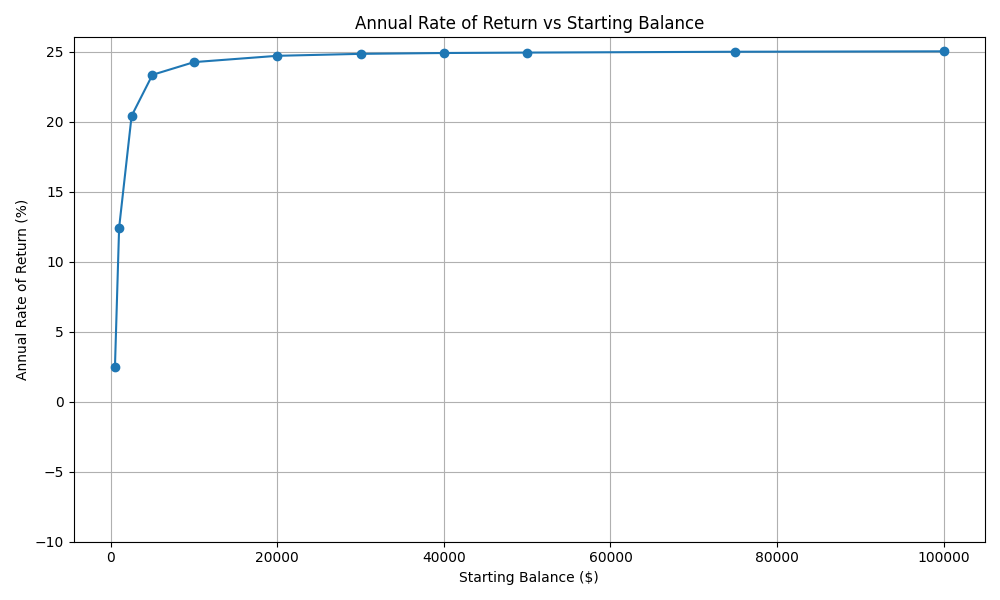
But we still haven’t answered the question: how much money do I need to invest in a trading strategy? Well, the answer depends on the rate of return an investor is willing to accept. The chart below plots the percentage return against the starting balance of the strategy. As the starting balance increases, so to does the return, until eventually plateauing at the point where the commission no longer matters. Thus, an investor can look at the curve of the below chart and find the starting balance that works for them.
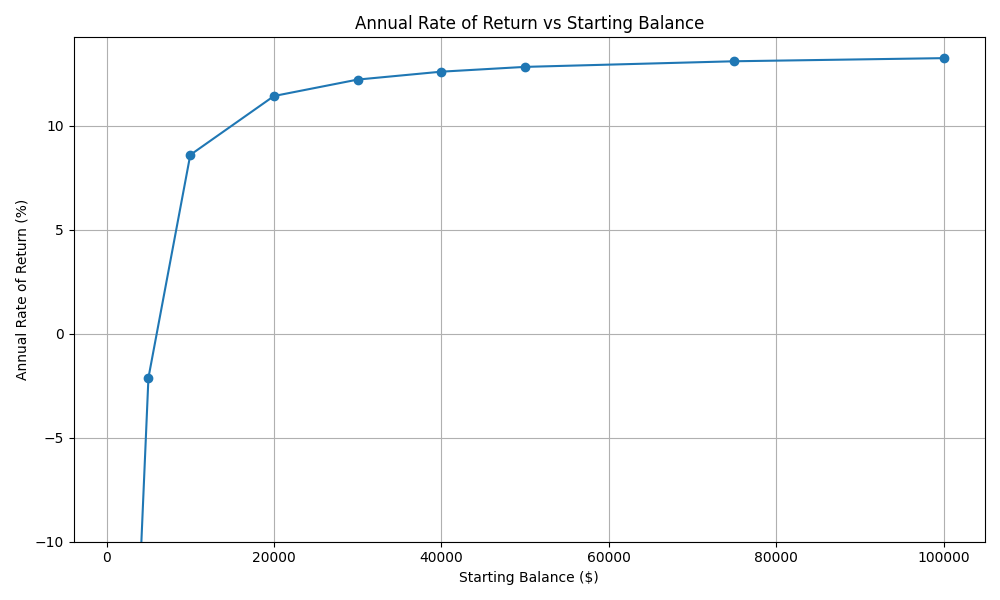
For reference, the ASX All Ordinaries had a total return (including dividends) of 8.67% for the same time period as shown in the chart above. So, in this case, a starting investment of $10,000 would be needed to equal the ASX All Ordinaries total return, but a starting balance of $20,000 would well surpass that.
For another example, we can do the same with the US Momentum strategy. This is still a relatively low-frequency strategy, but it has the advantage of lower commission fees that are available with the US market. In this case, we can use the Interactive Brokers’ fee structure, which is the maximum of $0.005 per share or 1% of the trade value. This presents us with more favourable returns at low values. In this case, even an investment as low as $500 provides a positive return (though a 2% return on $500 is hardly worth the effort).
So, the answer to the question, “how much money do I need to invest in a trading strategy?” is, as little as you are willing to tolerate for the diminished rate of return, OR as much as you are willing to invest to raise the rate of return. If you’d like to investigate our subscription trading strategies further, sign up for a free trial now to see the full historical returns for all of our trading systems.