
ETF Liquidity: There’s More Happening Under The Surface
Entering an illiquid asset can be an expensive mistake. With insufficient liquidity, a trader may be unable to exit an unwanted position or forced to sell at a subpar price. The two measures typically used for measuring a stock’s liquidity are the volume and the bid-ask spread. However, using these two measures can be misleading when used to assess the liquidity of an Exchange Traded Fund (ETF), as the liquidity is controlled by two interlinked markets, rather than one. Let’s take a look at how ETF liquidity differs from traditional shares and how this affects our trading strategies.
How do ETFs differ from traditional shares?
A traditional share represents ownership of a piece of a company. When shares are issued, the company stock is divided up into individual shares which are then sold off to raise capital. Because of this, there are a finite number of shares available at any given moment. This number of shares can change through company-led buybacks, rights issues, or share splits, but for the vast majority of the time, the number of stocks available stays fixed.
Most ETFs, on the other hand, represent a basket of assets. A physical gold ETF, for example, is backed by a stockpile of physical gold, and the price of the ETF on the stock market is effectively equal to the current market rate of gold. So, how then does the ETF provider ensure adequate liquidity and that the price of the ETF does not diverge from that of the underlying asset?
An ETF is not a static pool.
For many ETFs, unlike a traditional stock, the basket of assets represented by an ETF is not fixed in size. The number of outstanding shares in the ETF is open-ended, and the underlying pool of assets scales to match this. While a typical trade in an ETF (by you or me) changes hands on the exchange as a regular stock does, orders large enough to shift the ETF’s price away from the underlying asset’s price will cause the asset pool to change size. This is where the ETF’s primary and secondary markets come into play.
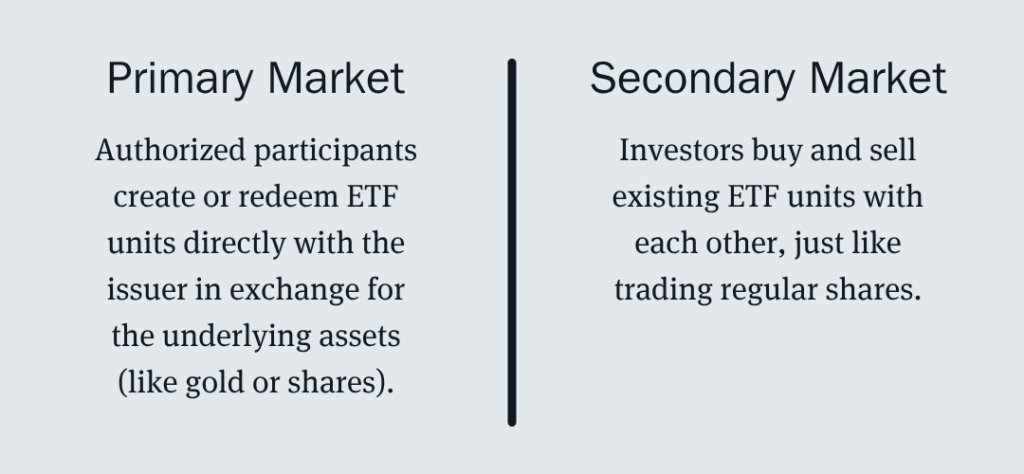
The Primary and Secondary Market
The ETF’s primary market occurs under the surface between large financial institutions. Certain market makers called Authorised Participants (APs) have the ability to create or redeem ETF units directly with the fund issuer. To do this the APs exchange the underlying asset directly for ETF units, which the AP can then sell on stock exchanges, profiting from the arbitrage (don’t panic, they do this with regular stocks too). Because of this cooperation between the ETF provider and the AP, the true liquidity of the stock generally mirrors that of the underlying asset. For assets like precious metals or major stock indexes, this means ETF liquidity is incredibly deep.
The secondary market, meanwhile, is the top layer viewable and tradable through your broker. The ETFs change hands between regular traders on the typical exchange, as with any other stock. But the key point here is that the volume and bid-ask spread presented by the broker is only that of the secondary market and does not consider the primary market. Even if an ETF’s volume looks low here, it does not mean the stock is illiquid, as it is backed by the underlying secondary market. However, not all ETFs benefit equally from this structure.

Does that mean all ETFs are liquid?
No. For an open-ended ETF (as in the case of physical gold ETFs), the liquidity of the secondary market is deep because gold is a highly liquid asset. This is also true for major stock indexes such as the S&P 500 or Nasdaq-100, as billions of stock units change hands every day. However, ETFs representing more illiquid assets such as small crypto coins or narrow market sectors will not have the same level of liquidity. Some ETFs might hold assets based on derivatives such as futures, which can also limit the liquidity.
How do I know if an ETF is liquid?
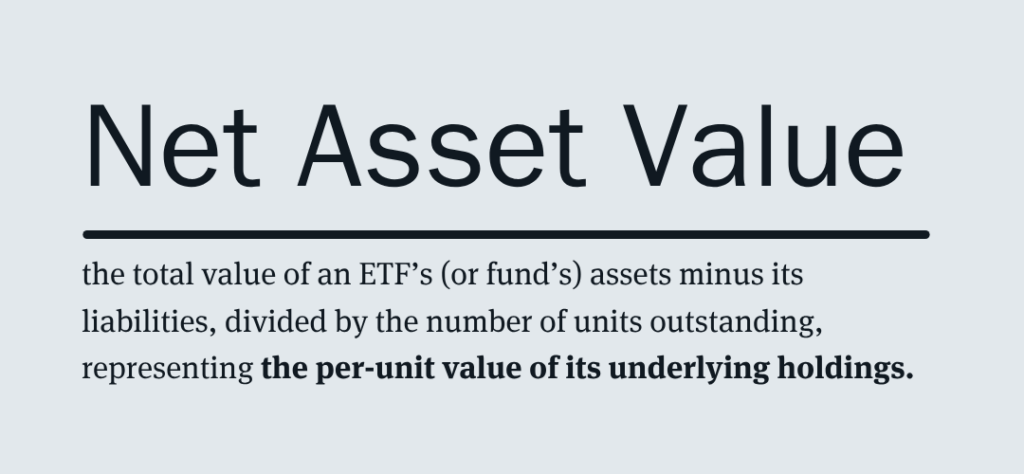
Legally, ETFs must have easily available product information available, including their structure, outstanding shares, and amount of assets under management. Take Global X Physical Gold, which we use in the ASX All Weather portfolio, as an example. A quick search finds the fund details here. Here you can find the important basic information such as total assets under management and outstanding shares, but also things like a full list of the ETFs Authorised Participants (who provide the gold), where the gold is stored (London), a full list of the ETF’s current bar stock (957,000 troy ounces), and details on the investors’ entitlement to the physical gold bars. Importantly though, we can also find the Net Asset Value (NAV) figure.
The NAV is a critical measure that tells us the value of the underlying asset corresponding with one ETF unit; that is, if I buy 1 unit of ETF, what value of the asset am I holding? The NAV is a simple calculation of the ETF’s total value minus liabilities, divided by the outstanding number of ETF units. An NAV very close to the market price indicates balanced supply and demand, a good sign for liquidity. It also tells us that we’re paying close to the true market value and not paying a significant premium. An ETF with an NAV that is consistently different from its market price is a warning sign of potential liquidity issues. Importantly, the NAV is usually updated at the end of the day, so don’t try and compare the NAV with an intraday price. Some ETFs, as in the case of Global X Physical Gold, will provide an intraday NAV figure (iNAV) which can be compared intraday.
Even with highly liquid assets like gold however, ETF pricing and liquidity can become temporarily disjointed. For example, if there is a significant move in gold prices while the ASX is closed, the ETF will gap on open and maybe temporarily have limited liquidity while the mechanisms catch up. In these cases, it is best to wait for the market to open before placing orders to allow time for the APs to regulate the supply.
Key Takeaways
In short, ETF liquidity operates on two levels: what you see on the exchange and what happens behind it, and understanding both is essential for making informed trading decisions.
- Unlike traditional stocks, ETFs typically do not have a fixed number of outstanding shares.
- An ETF can change hands on a regular exchange as with a traditional stock, but ETF liquidity is mainly driven by the primary market between the provider and Authorised Participants.
- The liquidity of the ETF is thus a combination of both the secondary surface market as well as the underlying primary market.
- The existence of the primary market does not remove liquidity worries; ETFs based on low liquidity underlying assets such as small cap indexes or niche commodities may still experience liquidity problems.
- Investors should check the ETF information before investing in an ETF.
To see some of the ETFs we are using to in our All Weather strategies, take a 14 day free trial and look at our recent trades in our trade history tables.