
Chart Research Outlook With Scott Goddard
Today (7th November 2025) seemed like a suitable time to hand over to our global markets guru Scott Goddard to take a closer look at the S&P 500 and ASX 200 outlooks. Membership of The Chartist provides access to daily chart research for the ASX and Global markets, including video analysis and trade recommendations from Scott Goddard and Pete Hammersley. Take a free two-week trial for full access!
S&P 500 Index (S&P 500)
Bottom Line
6-Nov-2025:
Daily Trend: Neutral
Weekly Trend: Up
Monthly Trend: Up
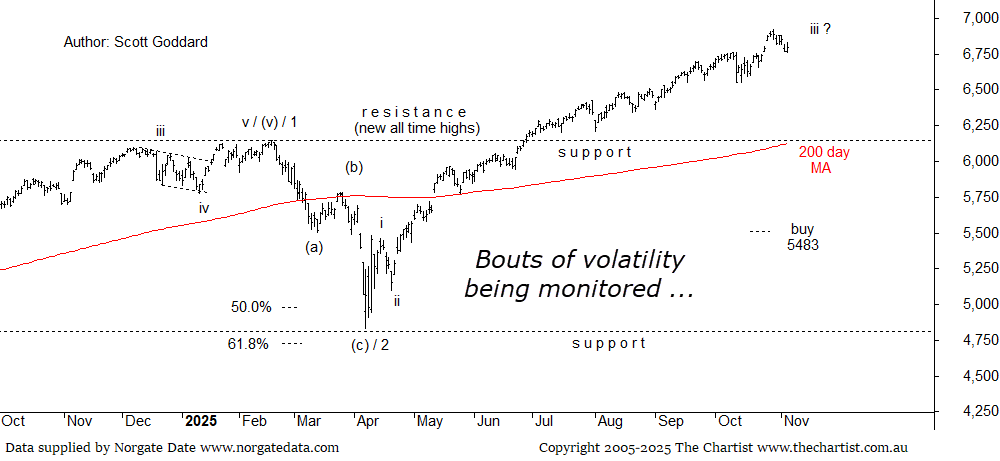
Support Levels: 6550 / 6343 / 6148
Resistance Levels: N/A (new all-time highs)
Technical Discussion
Reasons to remain bullish:
→ Elliott Wave count remains bullish bigger picture basis our longer-term analysis
→ The 6148 zone (2025 all-time highs) continues to act as new major support
→ Interest rates and global political issues, in relation to tariffs and Middle East conflicts, remain in focus
→ price is trading into new all time highs on a regular basis and remaining relaxed for now
→ any dips continue to be bought back up on quickly
U.S. stocks rebounded on Wednesday as concerns about inflated tech stock valuations abated and upbeat earnings and better-than-expected economic data fuelled investors’ risk appetite once again. A broad rally sent all three major U.S. equity indexes higher last night, with a bounce-back in tech and tech-related momentum stocks leading the charge. Technology and artificial intelligence-related shares have pushed the stock market to record-breaking highs in recent months, leading to worries of inflated valuations and prompting many to issue pullback warnings. Those worries came to a head on Tuesday, when the S&P 500 and the Nasdaq posted their largest single-day percentage drops since October 10. Valuation concerns are always legitimate of course yet history has shown that stock markets can continue north in bull runs for longer than anticipated. The Nasdaq in 1998 was a classic example of this when all the talk was that it was in a bubble and that it was going to crash. And crash it did yet two years later than what the doomsayers were saying, in which time the Index locked in some absolutely mind-boggling gains. So, the advice as always is to follow price action and not the rhetoric coming out of the mouths of so called experts, as their rhetoric is very rarely timed well!
The only thing that has really changed here is that we are starting to see some bouts of volatility become a little bit more frequent. It’s a significant observation though as this is the type of thing that can eventually break the higher high higher low routine that has been in place since April. Week in and week out we have continued to look for our minor degree wave-(iii) to lock in a high, yet as any weakness to this point has only been shallow and swift, none have taken on the characteristics of a wave-(iv) which needs to be deeper than what we have witnessed and more complex and prolonged from a timing perspective. So until we witness this it is simply onward and upward for the wave-iii.
Worth noting is that if price swings higher yet again from here which has been the short to medium term routine on this push north, then our Type-A bearish divergence will return again and team up once more with an overbought weekly divergence indicator. A combination that generally brings out some sellers be it to this point in time this has not proven to be the case. So for now we are just happy to sit back and allow price action to do its thing, whilst at the same time recognising that this immediate wave-iii is now super extended and highly evolved, which means a breather could happen at any time from here. Yet how long have we been saying this for !!
ASX SPI-200 (YAP)
Bottom Line
6-Nov-2025:
Daily Trend: Down
Weekly Trend: Down
Monthly Trend: Up
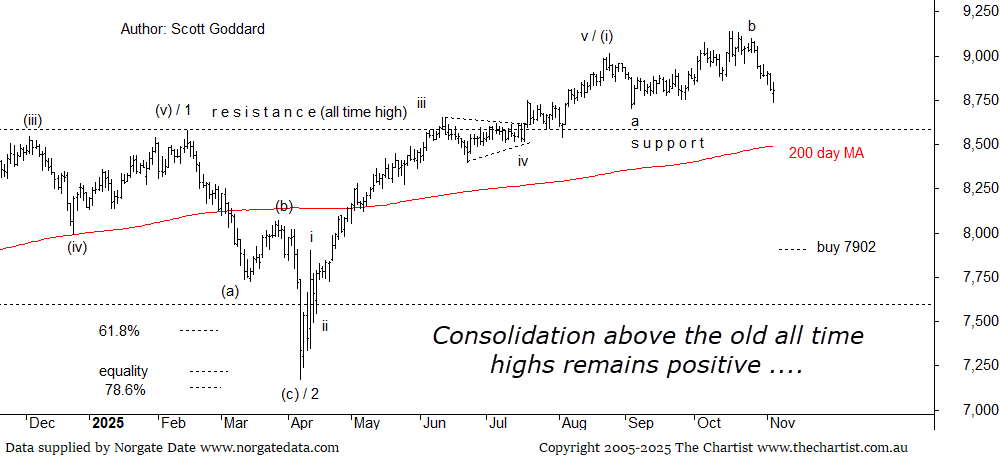
Support Levels: 8651 (old all time high) / 8400 / 8123 (December 2025 contract)
Resistance Levels: 9138 (new all-time highs)
Technical Discussion
Reasons to remain bullish (longer term):
→ an inflationary environment potentially favourable for commodity-driven economies like Australia
→ Secular bull markets emerging or in play for select commodities and metals
→ a hawkish interest rate environment has now toned down yet the rhetoric is not dovish either
→ price is pushing consistently into new all time highs
Yesterday our markets headed well lower following Wall Streets negative lead and also under the general acceptance now that the RBA won’t be cutting interest rates any further. All but the Healthcare sector was down yesterday, with Resources and Utilities hit the hardest. Commodity prices were generally lower, with iron ore, lithium, and uranium prices bearing the brunt of investor selling. So it goes without saying that local uranium stocks were hit particularly hard on Wednesday as well. U.S markets though revealed their split personality yet again last night reversing some of the losses from the previous session. The ASX SPI-200 last night dipped initially to lock in a lower low yet it ended up closing quite strong. Lets take a look at the technicals.
The standout pattern here is the sideways consolidation that has been unfolding since mid-year. As we know, consolidation above strong lines of old resistance now potentially acting as support has a high probability of eventually breaking out higher rather than lower. We have seen it time and time again on these pages with the vast majority of outcomes being positive when these patterns form. So right at this juncture, even though slightly lower is still possible with the old all time highs being aligned to 8651, we are continuing to anticipate that the next cycle is going to be solidly north rather than south.
From an EW perspective we are continuing to run with the same bullish interpretation of the trend with a minor degree wave-(i) of 3 high locked in back in August with a wave-(ii) breather still playing out and looking to lock in a low sooner rather than later with this consolidation phase now looking highly evolved. And if our analysis proves to be correct, then the next move north will be part of a wave-(iii) of 3 and these types of waves are generally very strong and impulsive. The Type-A bearish divergence on the dailies that is still in play has almost fully unwound back to oversold now, with the Type-A bearish on the weeklies having triggered yet still requiring a few weeks to fully unwind via a guesstimate. So overall we continue to remain bouyed with what is continuing to evolve here, with the longer term uptrend still looking like it has plenty more gas left in the tank just yet!